

Question: solve these Compute the sample variance and standard deviation for the water absorbency data of Exercise 1.2 on page 13. Reference: Exercise 1.2 According to
solve these
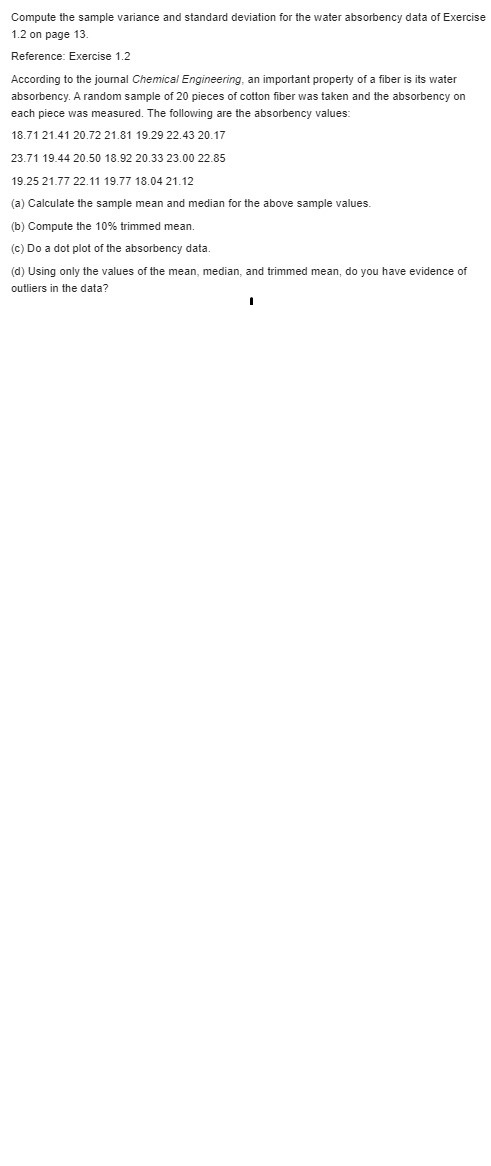
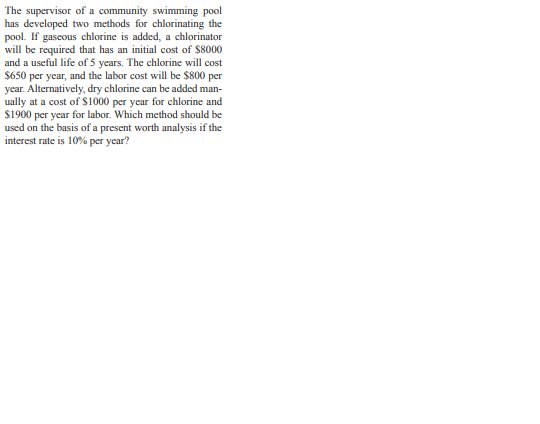
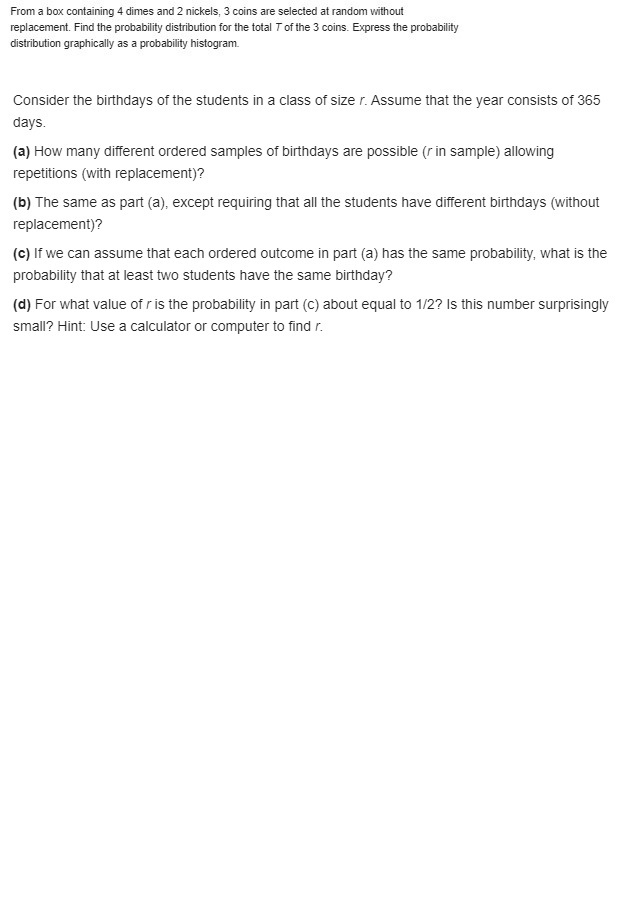
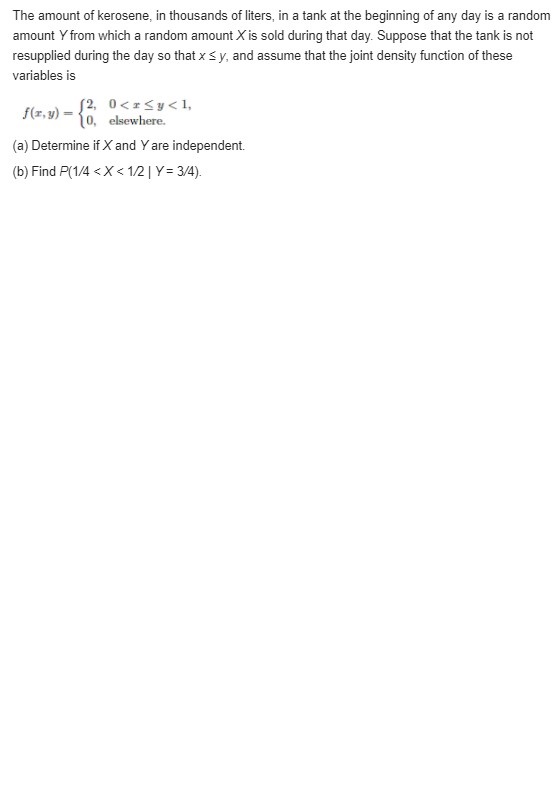
Compute the sample variance and standard deviation for the water absorbency data of Exercise 1.2 on page 13. Reference: Exercise 1.2 According to the journal Chemical Engineering, an important property of a fiber is its water absorbency. A random sample of 20 pieces of cotton fiber was taken and the absorbency on each piece was measured. The following are the absorbency values: 18.71 21.41 20.72 21.81 19.29 22.43 20.17 23.71 19.44 20.50 18.92 20.33 23.00 22.85 19.25 21.77 22.11 19.77 18.04 21.12 (a) Calculate the sample mean and median for the above sample values. (b) Compute the 10% trimmed mean. (c) Do a dot plot of the absorbency data. (d) Using only the values of the mean, median, and trimmed mean, do you have evidence of outliers in the data?The supervisor of a community swimming pool has developed two methods for chlorinationg the pool. If gaseous chlorine is added, a chlorinator will be required that has an initial cost of $8000 and a useful life of 5 years. The chlorine will cost $650 per year, and the labor cost will be $800 per year. Alternatively, dry chlorine can be added man- ually at a cost of $1000 per year for chlorine and $1900 per year for labor. Which method should be used on the basis of a present worth analysis if the interest rate is 10% per year?From a box containing 4 dimes and 2 nickels, 3 coins are selected at random without replacement. Find the probability distribution for the total 7 of the 3 coins. Express the probability distribution graphically as a probability histogram. Consider the birthdays of the students in a class of size r. Assume that the year consists of 365 days. (a) How many different ordered samples of birthdays are possible (r in sample) allowing repetitions (with replacement)? (b) The same as part (a), except requiring that all the students have different birthdays (without replacement)? (c) If we can assume that each ordered outcome in part (a) has the same probability, what is the probability that at least two students have the same birthday? (d) For what value of r is the probability in part (c) about equal to 1/2? Is this number surprisingly small? Hint: Use a calculator or computer to find r.The amount of kerosene, in thousands of liters, in a tank at the beginning of any day is a random amount Y from which a random amount X is sold during that day. Suppose that the tank is not resupplied during the day so that x sy, and assume that the joint density function of these variables is 12, 0
Step by Step Solution
There are 3 Steps involved in it

Get step-by-step solutions from verified subject matter experts