

Question: Solve the given example taking psas 2.64+D, Plot the compaction curve on milimetric paper with a proper scaling. For section find the degree of saturation
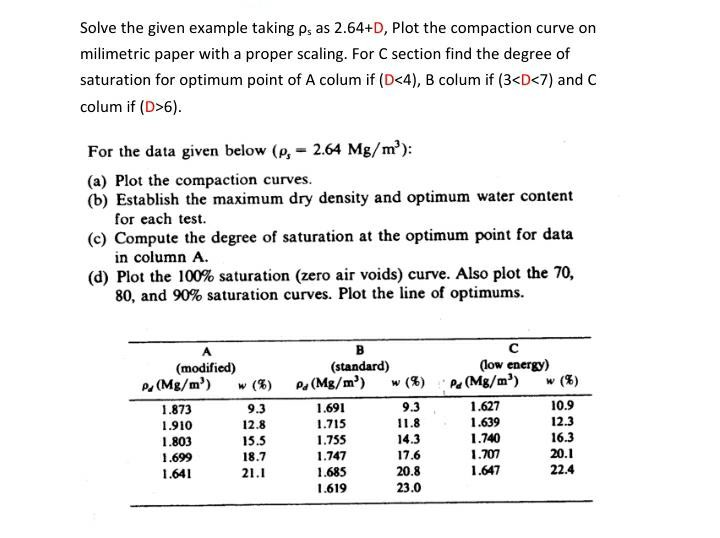
Solve the given example taking psas 2.64+D, Plot the compaction curve on milimetric paper with a proper scaling. For section find the degree of saturation for optimum point of A colum if (D6). For the data given below (P, - 2.64 Mg/m): (a) Plot the compaction curves. (b) Establish the maximum dry density and optimum water content for each test. (c) Compute the degree of saturation at the optimum point for data in column A. (d) Plot the 100% saturation (zero air voids) curve. Also plot the 70, 80, and 90% saturation curves. Plot the line of optimums. (modified) P. (Mg/m') 1.873 9.3 1.910 12.8 1.803 15.5 1.699 18.7 1.641 21.1 B (standard) P.(Mg/m') 1.691 1.715 1.755 1.747 1.685 1.619 9.3 11.8 14.3 17.6 20.8 23.0 (low energy) Pa (Mg/m) 1.627 10.9 1.639 12.3 1.740 16.3 1.707 20.1 1.647 22.4
Step by Step Solution
There are 3 Steps involved in it

Get step-by-step solutions from verified subject matter experts