

Question: Solve the given LP graphically Use the graph paper provided to present your solution [ Use the area below for your calculations ] Draw and
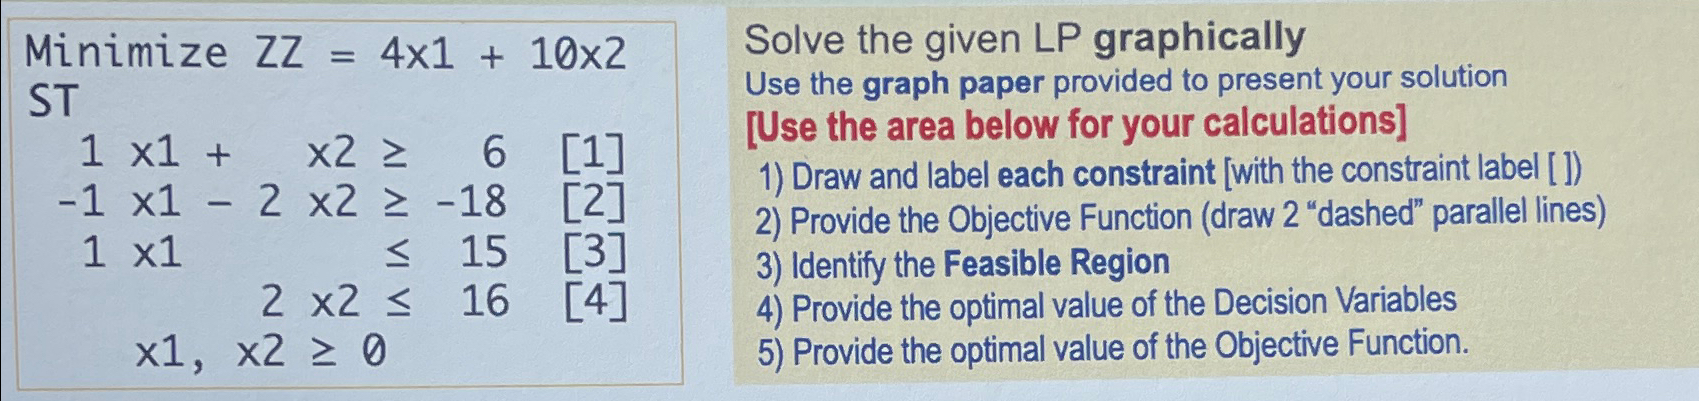
Solve the given LP graphically
Use the graph paper provided to present your solution Use the area below for your calculations
Draw and label each constraint with the constraint label
Provide the Objective Function draw "dashed" parallel lines
Identify the Feasible Region
Provide the optimal value of the Decision Variables
Provide the optimal value of the Objective Function.
Step by Step Solution
There are 3 Steps involved in it
1 Expert Approved Answer
Step: 1 Unlock

Question Has Been Solved by an Expert!
Get step-by-step solutions from verified subject matter experts
Step: 2 Unlock
Step: 3 Unlock