Question: Solve the model by using LINGO 19.0 and display the solution clearly, also do and propose the sensitivity analysis with LINGO. A company wishes to
Solve the model by using LINGO 19.0 and display the solution clearly, also do and propose the sensitivity analysis with LINGO.
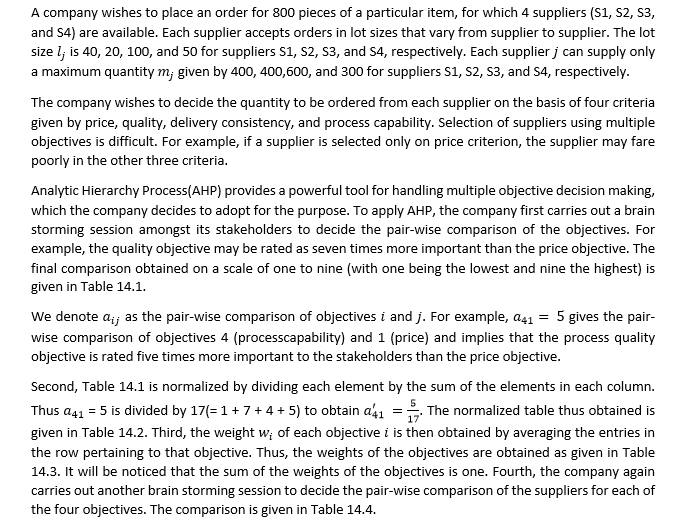
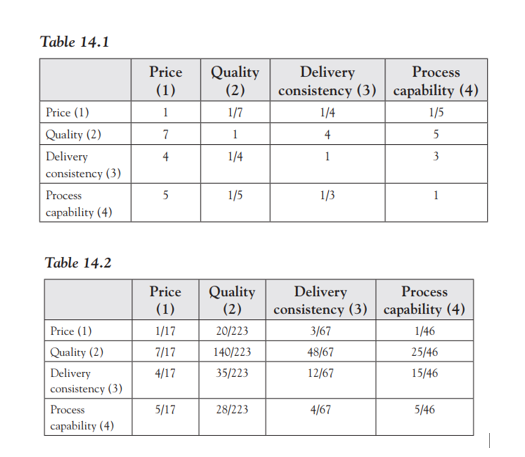
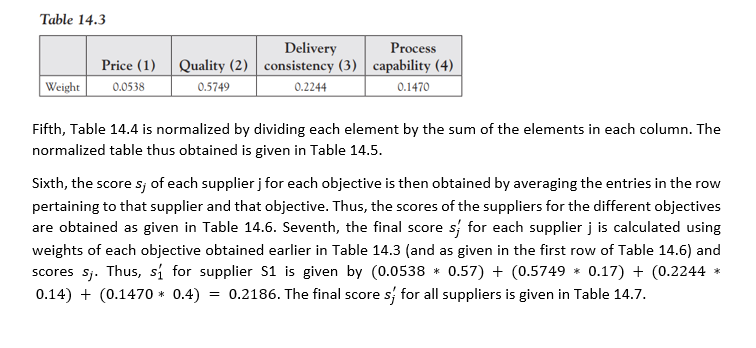
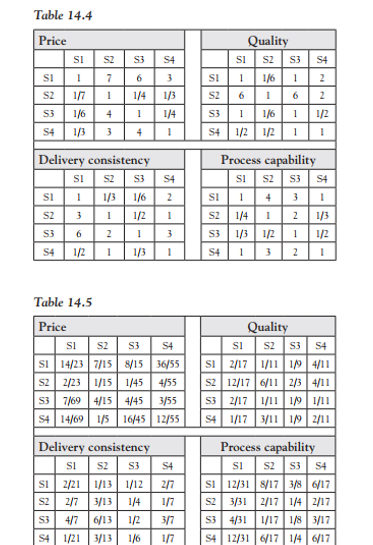
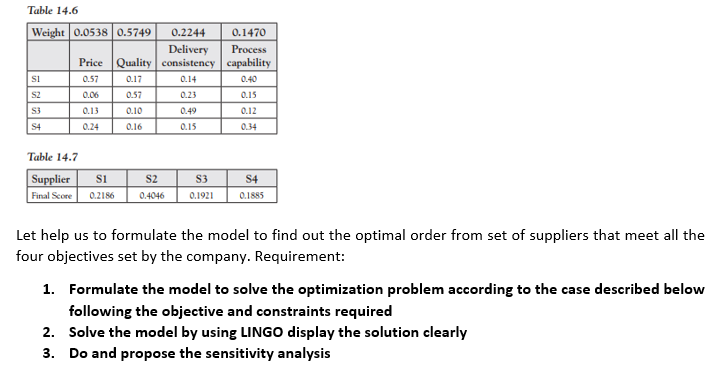
A company wishes to place an order for 800 pieces of a particular item, for which 4 suppliers (S1, S2, S3, and S4) are available. Each supplier accepts orders in lot sizes that vary from supplier to supplier. The lot size l; is 40, 20, 100, and 50 for suppliers S1, S2, S3, and S4, respectively. Each supplier j can supply only a maximum quantity m; given by 400, 400,600, and 300 for suppliers S1, S2, S3, and S4, respectively. The company wishes to decide the quantity to be ordered from each supplier on the basis of four criteria given by price, quality, delivery consistency, and process capability. Selection of suppliers using multiple objectives is difficult. For example, if a supplier is selected only on price criterion, the supplier may fare poorly in the other three criteria. Analytic Hierarchy Process(AHP) provides a powerful tool for handling multiple objective decision making, which the company decides to adopt for the purpose. To apply AHP, the company first carries out a brain storming session amongst its stakeholders to decide the pair-wise comparison of the objectives. For example, the quality objective may be rated as seven times more important than the price objective. The final comparison obtained on a scale of one to nine (with one being the lowest and nine the highest) is given in Table 14.1. We denote dij as the pair-wise comparison of objectives i and j. For example, 041 = 5 gives the pair- wise comparison of objectives 4 (processcapability) and 1 (price) and implies that the process quality objective is rated five times more important to the stakeholders than the price objective. Second, Table 14.1 is normalized by dividing each element by the sum of the elements in each column. Thus 041 = 5 is divided by 17(= 1 + 7 + 4 + 5) to obtain a'41 = The normalized table thus obtained is given in Table 14.2. Third, the weight w; of each objective i is then obtained by averaging the entries in the row pertaining to that objective. Thus, the weights of the objectives are obtained as given in Table 14.3. It will be noticed that the sum of the weights of the objectives is one. Fourth, the company again carries out another brain storming session to decide the pair-wise comparison of the suppliers for each of the four objectives. The comparison is given in Table 14.4. Table 14.1 Price (1) 1 Quality (2) 1/7 1 1/4 Delivery Process consistency (3) capability (4) 1/4 1/5 7 4 5 4 Price (1) Quality (2) Delivery consistency (3) Process capability (4) 1 3 5 1/5 1/3 1 Table 14.2 Price (1) Quality (2) Delivery consistency (3) Process capability (4) Price (1) 1/17 7/17 4/17 Quality (2) 20/223 140/223 35/223 Delivery Process consistency (3) capability (4) 3/67 1/46 48/67 25/46 12/67 15/46 5/17 28/223 4/67 5/46 Table 14.3 Price (1) 0.0538 Delivery Process Quality (2) consistency (3) capability (4) 0.5749 0.2244 0.1470 Weight Fifth, Table 14.4 is normalized by dividing each element by the sum of the elements in each column. The normalized table thus obtained is given in Table 14.5. Sixth, the score s; of each supplier j for each objective is then obtained by averaging the entries in the row pertaining to that supplier and that objective. Thus, the scores of the suppliers for the different objectives are obtained as given in Table 14.6. Seventh, the final scores for each supplier j is calculated using weights of each objective obtained earlier in Table 14.3 (and as given in the first row of Table 14.6) and scores sj. Thus, s for supplier S1 is given by (0.0538 * 0.57) + (0.5749 * 0.17) + (0.2244 * 0.14) + (0.1470 * 0.4) = 0.2186. The final scores for all suppliers is given in Table 14.7. Table 14.4 Price SI S2 S3 S4 1 7 6 3 SI SZ SI S2 - Quality SI S2 S3 S4 1 1/6 1 2 616 2 1 1/6 1 1/2 1/2 12 11 117 1/4 1/3 | S3 4 1 S3 1/6 1/3 1/4 1 S4 3 4 S4 S4 IN Delivery consistency Sis2 S3 SI 1 1/3 1/6 SZ 1 1/2 S3 6 2 1 1/2 1 1/3 Process capability SI S2 S3 S4 SI 1 S2 1/4 12 1/3 S3 1/3 12 1 112 132 1 1 3 54 1 54 Table 14.5 Price SI S2 S3 S4 SI 14/237/15 8/15 36/55 S2 2/23 1/15 1/45 4/55 S3 7/69 4/154/45 3/55 S4 14/69 1/5 16/45 12/55 Quality SI S2 S3 S4 SI 2/171/11 1/94/11 S2 12/17 6/11 2/3 4/11 S32/17 1/11 1191/11 S4 1/173/11 1192/11 Process capability Si S2 S3 SI 12/31 8/17 3/86/17 S2 3/31 2/17 1/42/17 S34/31 1/171/83/17 S4 12/316/17 | 1/46/17 S4 S4 Delivery consistency SI S2 S3 SI 2/21 1/13 1/12 S2 2/7 3/13 1/4 S3 4/7 6/13 1/2 S4 1/21 3/13 1/6 217 1/7 3/7 1/2 Table 14.6 Weight 0.0538 0.5749 0.2244 0.1470 Delivery Process Price Quality consistency capability SI 0.57 0.17 0.14 0.40 SZ 0.06 0.57 0.23 0.15 S3 0.13 0.10 0.49 0.12 S4 0.24 0.16 0.15 0.34 Table 14.7 SI Supplier Final Score S2 0.4046 S3 0.1921 S4 0.1895 0.2186 Let help us to formulate the model to find out the optimal order from set of suppliers that meet all the four objectives set by the company. Requirement: 1. Formulate the model to solve the optimization problem according to the case described below following the objective and constraints required 2. Solve the model by using LINGO display the solution clearly 3. Do and propose the sensitivity analysis Lingo 19.0 - Lingo Model - Lingo1 File Edit Solver Window Help ?? Lingo Model - Lingo1


