Question: Solve the problem by using both excel and manual methods and include them both in your discussion and findings. For NPV profile, all
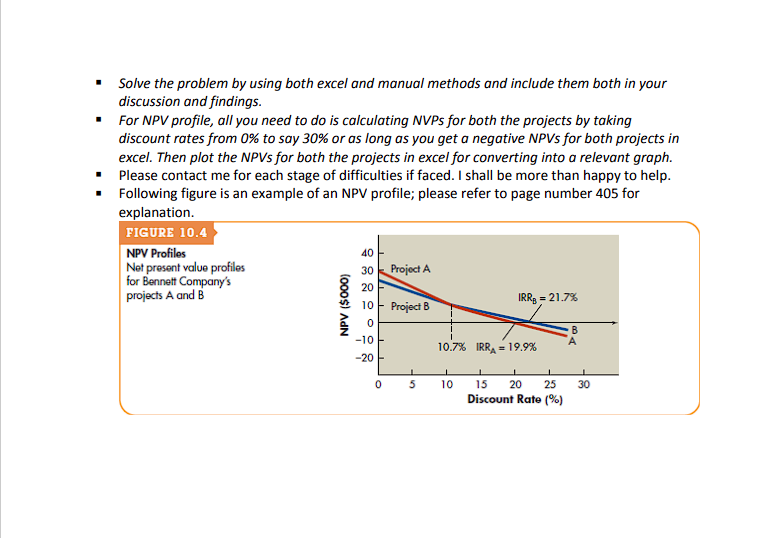
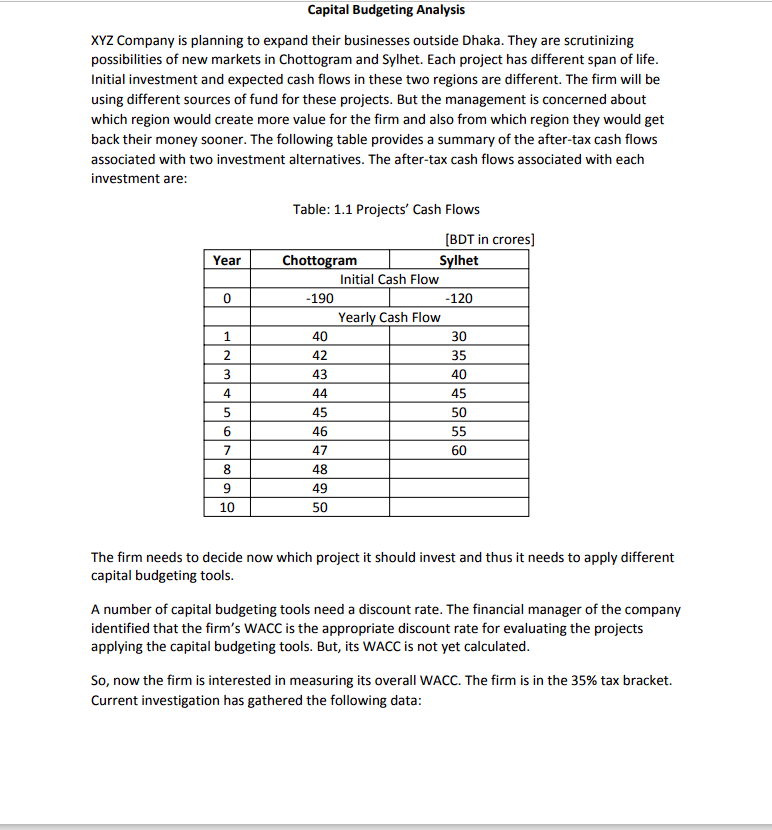
" Solve the problem by using both excel and manual methods and include them both in your discussion and findings. " For NPV profile, all you need to do is calculating NVPs for both the projects by taking discount rates from 0% to say 30% or as long as you get a negative NPVs for both projects in excel. Then plot the NPVs for both the projects in excel for converting into a relevant graph. Please contact me for each stage of difficulties if faced. I shall be more than happy to help. Following figure is an example of an NPV profile; please refer to page number 405 for explanation. FIGURE 10.4 NPV Profiles Net present value profiles 30 Project A for Bennett Company's 20 projects A and B IRR: = 21.7% NPV ($000) 10 - Project B -10 10.7% IRRA = 19.9% -20 0 5 10 15 20 25 30 Discount Rate (%)Capital Budgeting Analysis KY2 Company is planning to expand their businesses outside Dhaka. They are scrutinizing possibilities of new markets in Chottogram and Svlhet. Each project has different span of life. Initial investment and expected cash ows in these two regions are different. The firm will be using different sources of fund for these projects. But the management is concerned about which region would create more value for the firm and also from which region theyr would get back their monev sooner. The following table provides a summaryr of the after-tar. cash ows associated with two investment alternatives. The after-tax cash flows associated with each investment are: Table: 1.1 Projects\" Cash Flows [EDT in crores] -mmm- _ \" - The firm needs to decide now which project it should invest and thus it needs to applv different capital budgeting tools. A number of capital budgeting tools need a discount rate. The financial manager of the companyr identified that the rm's WACC is the appropriate discount rate for evaluating the projects applying the capital budgeting tools. But, its WACC is not vet calculated. So, now the rm is interested in measuring its overall WACC. The firm is in the 35% tax bracket. Current investigation has gathered the following data: Debt (Bond): The firm can issue bond with BDT 1,000 par value, 12% coupon interest rate, 5- year maturity bonds on which annual interest payments will be made. Current market price of the bond is BDT 1,200. Preferred stock: The firm's preferred stock is currently selling for BDT 115. The firm pays BDT 12 per preferred share as dividend. The cost of issuing and selling the preferred stock is expected to be BDT 2.0 per share. Common stock (New issue): The firm's common stock is currently selling for BDT 95 per share. The firm expects to pay cash dividends of BDT 5 per share next year. The firm's dividends have been growing at an annual rate of 8%, and this rate is expected to continue in the future Floatation costs are expected to amount to BDT 3.5 per share. The financial manager of the company is already overwhelmed with enormous workload and hence hired you as the assistant manager of the finance department for the company and seeing your competence in the area of finance assigned you to suggest the best route based on the following calculations: Requirements: 1. Calculate specific cost of each source of financing. 2. Calculate WACC (The firm's optimum capital structure shows 35% debt; 20% Preferred stock, and 45% Common stock equity). 3. Determine the Payback period and Net present value by taking WACC as discount rate. 4. Develop a Net Present Value Profile and explain its implications. You can only depict a NPV profile only after calculating the NPV and IRR. 5. Which region is the best region if they are independent or mutually exclusive projects? 6. Suppose Chottogram region is riskier due to the possible entry of new competitors in the future. How may this affect your decision and why? Discuss this issue from theoretical point of view (no need to do further calculations). Notes: This is a presentation topic, so follow a basic report format to describe the findings (the required calculations) for each of the above questions. That means, instead of describing the findings, do not list your answers like answer to the question # 1, answer to the question # 2, ... etc. Instead convert the interrogative sentence into an assertive sentence. Such as, project evaluation - calculation of NPVs of both projects. Then for IRR, use the same style. You should already know the basic report format. If you are unsure (not sure why you would be unsure at this stage!), find one and show me before finalizing the report. You need to submit both a report and a PowerPoint slide day before the presentation. For each unfamiliar term (why there would still be any!), refer to your text book, any other finance book, and web for getting clear idea. For any help, please contact me instead of asking your mate(s) who also will have no idea about the answer and will confuse you for sure. This exercise will help you to conceptualize and learn the basics of finance and also refresh your past lessons such as report writing skills, presentation skills etc. If you can demonstrate your skills which you have acquired over the years, the objective of your effort will be attained. Otherwise, it would be a waste of time for both of us
Step by Step Solution
There are 3 Steps involved in it
1 Expert Approved Answer
Step: 1 Unlock
Question Has Been Solved by an Expert!
Get step-by-step solutions from verified subject matter experts
Step: 2 Unlock
Step: 3 Unlock
Students Have Also Explored These Related Finance Questions!