

Question: Solve the problem. The graph shows the height h (in meters) of a roller coaster t seconds after the ride starts. h Height (ft)
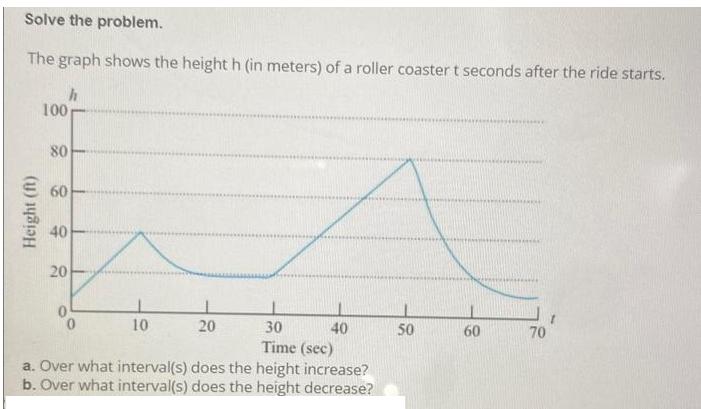


Solve the problem. The graph shows the height h (in meters) of a roller coaster t seconds after the ride starts. h Height (ft) 100 80 60 40 20 0 30 Time (sec) a. Over what interval(s) does the height increase? b. Over what interval(s) does the height decrease? 10 20 40 50 60 70 Write the domain in interval notation. f(x) = 16x +100 Write the domain in interval notation. f(x) = x-4 x-5 Determine the x- and y-intercepts for the given function. B(x) = 7x + 3
Step by Step Solution
★★★★★
3.39 Rating (168 Votes )
There are 3 Steps involved in it
1 Expert Approved Answer
Step: 1 Unlock

Question Has Been Solved by an Expert!
Get step-by-step solutions from verified subject matter experts
Step: 2 Unlock
Step: 3 Unlock