

Question: Solve the problem. The table shows the number satisfied in their work in a sample of working adults with a college education and in a
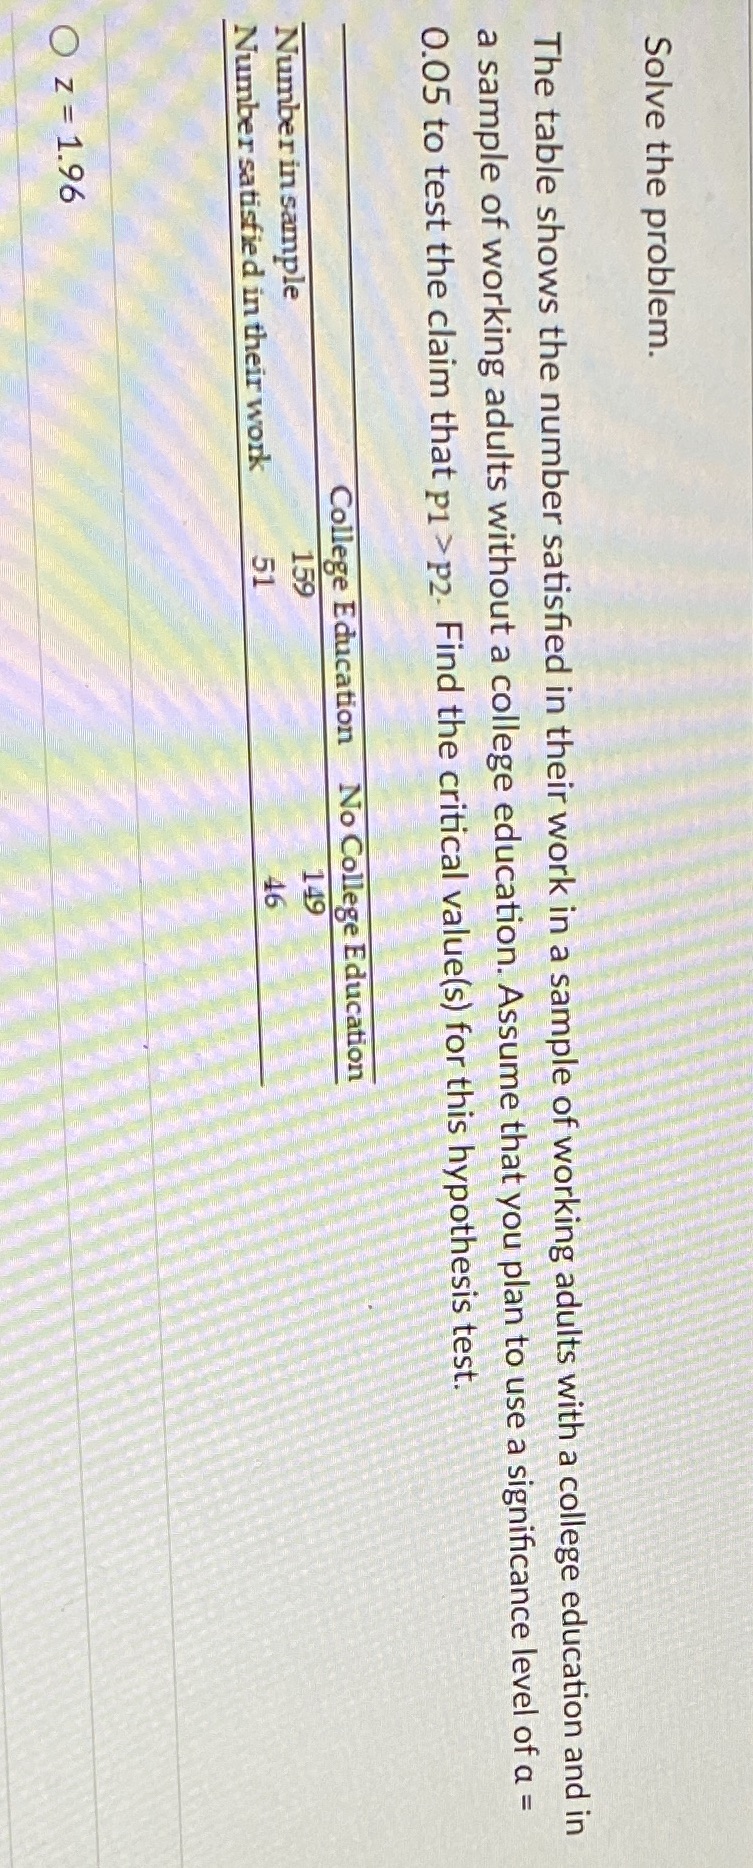
Solve the problem. The table shows the number satisfied in their work in a sample of working adults with a college education and in a sample of working adults without a college education. Assume that you plan to use a significance level of a = 0.05 to test the claim that p1 > p2. Find the critical value(s) for this hypothesis test. College Education No College Education Number in sample 159 149 Number satisfied in their work O z = 1.96
Step by Step Solution
There are 3 Steps involved in it
1 Expert Approved Answer
Step: 1 Unlock

Question Has Been Solved by an Expert!
Get step-by-step solutions from verified subject matter experts
Step: 2 Unlock
Step: 3 Unlock