

Question: Solve the problems and answer 1 The data below show the Fat and Calories in fast-food hamburgers. Amodel was created that can estimate the number
Solve the problems and answer
1
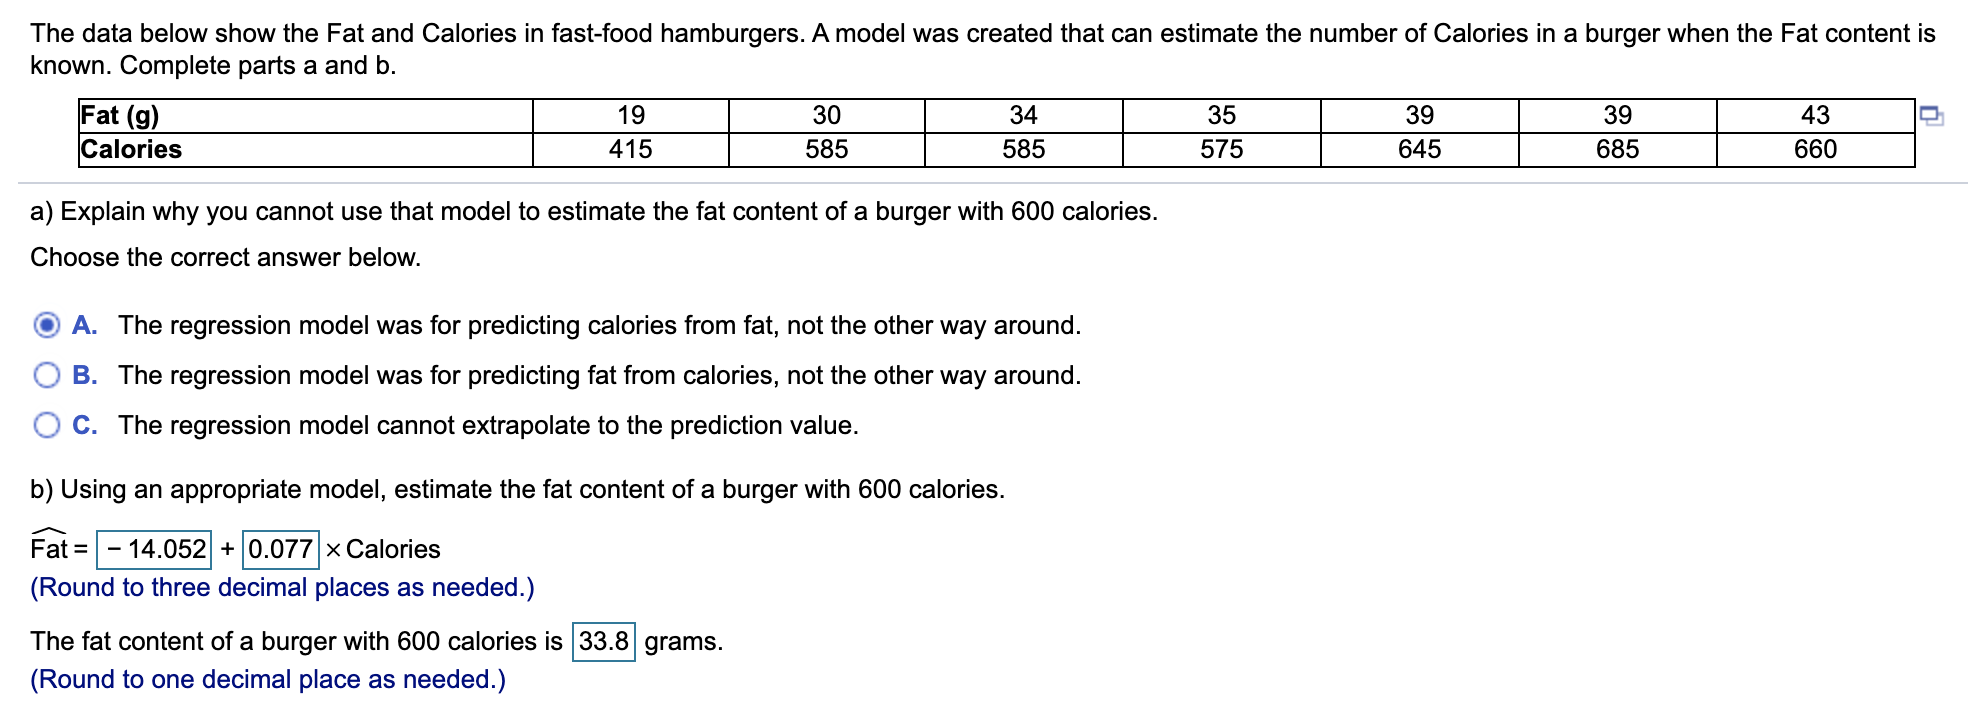
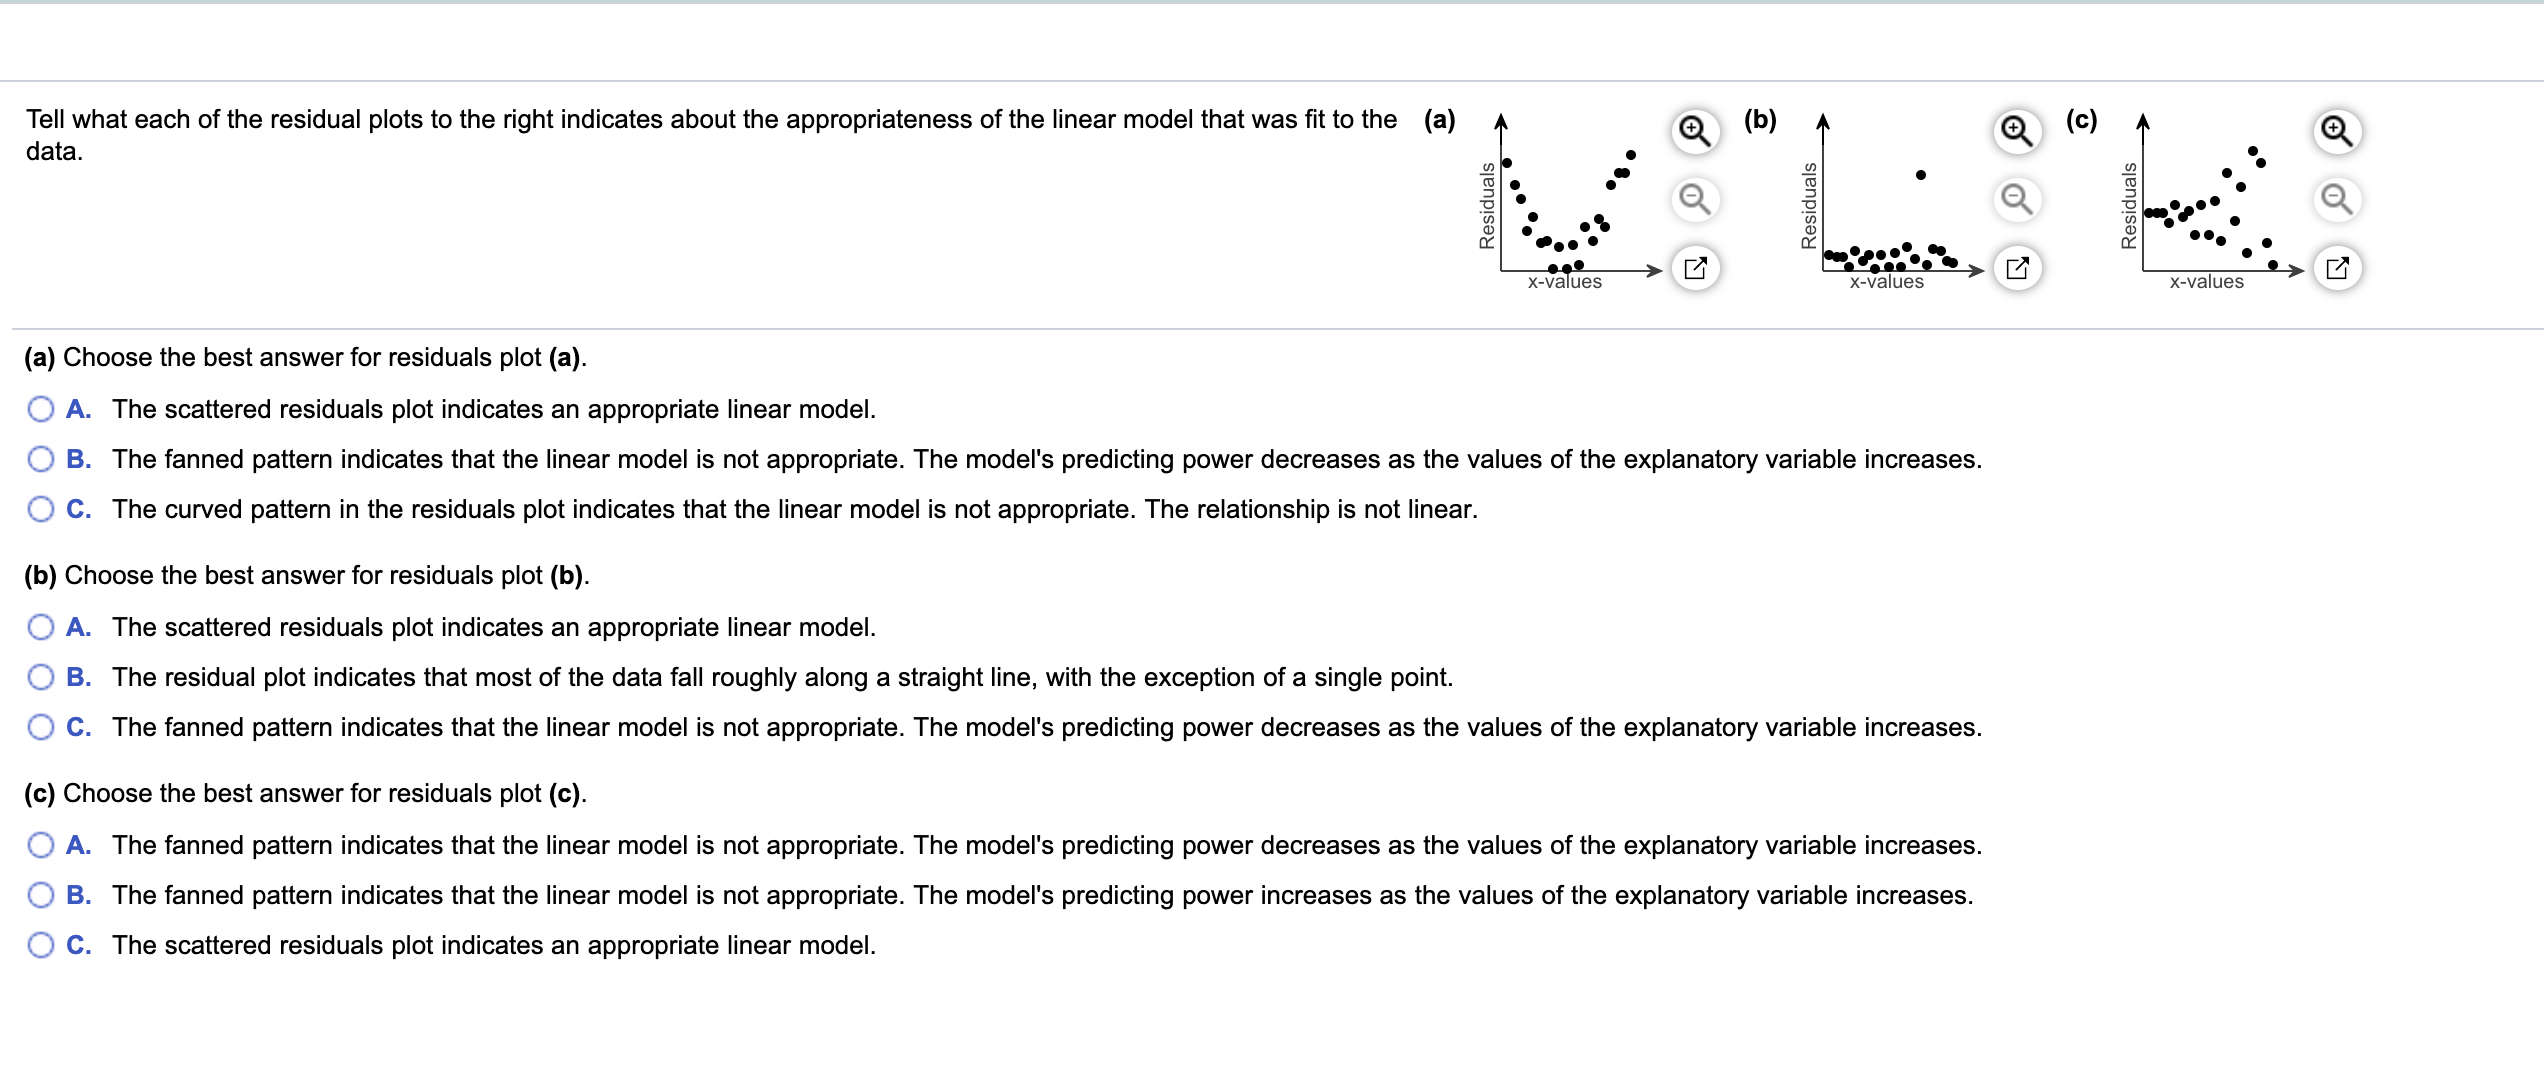
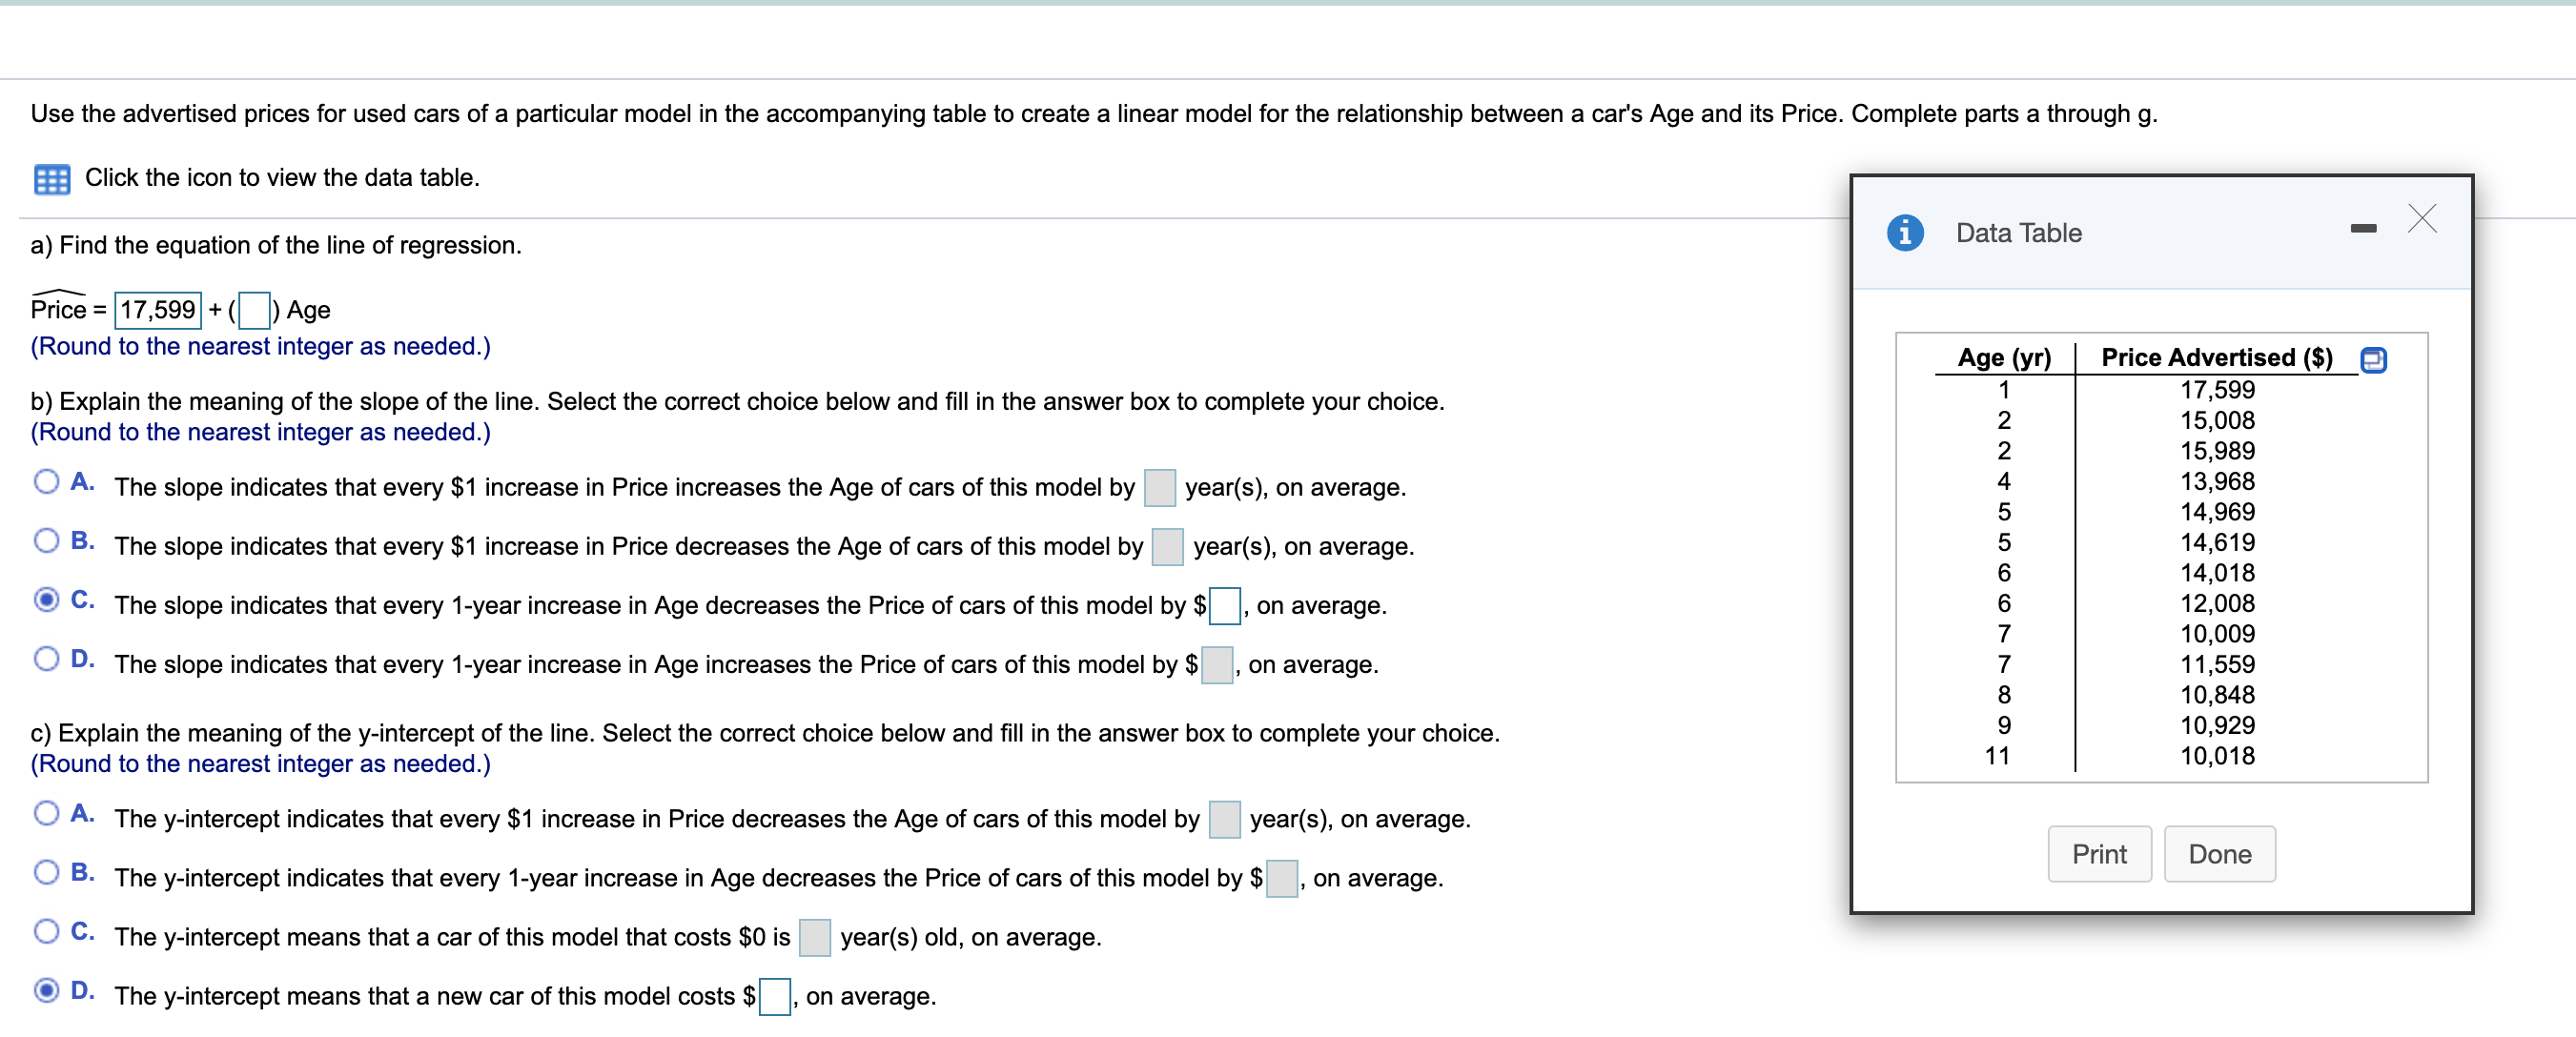
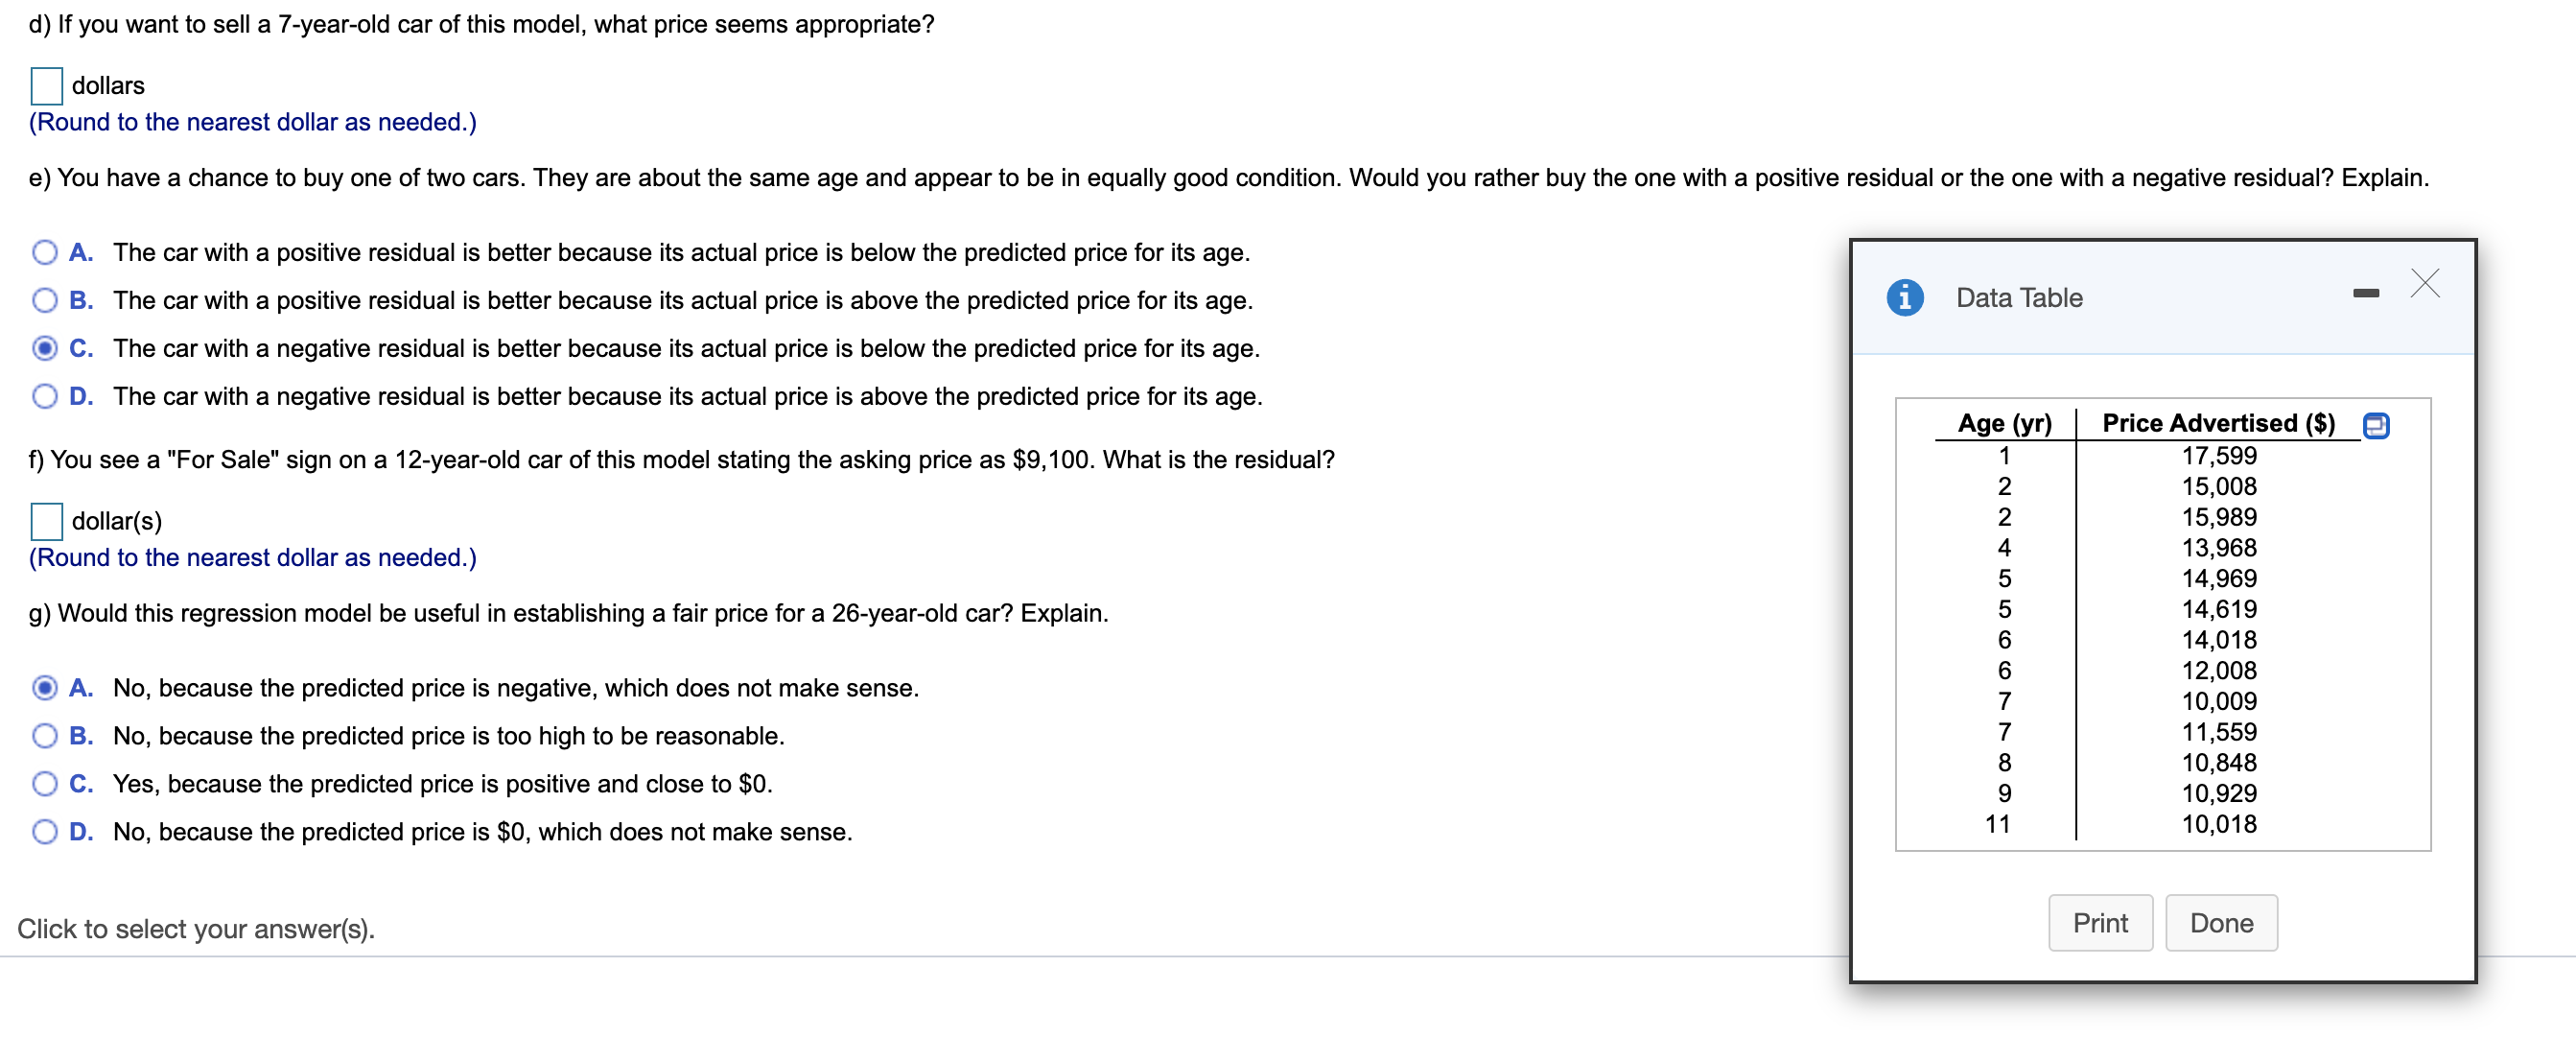
The data below show the Fat and Calories in fast-food hamburgers. Amodel was created that can estimate the number of Calories in a burger when the Fat content is known. Complete parts a and b. Fat (9) 19 30 34 35 39 39 43 Calories 415 585 585 575 645 685 660 a) Explain why you cannot use that model to estimate the fat content of a burger with 600 calories. Choose the correct answer below. 6) A. The regression model was for predicting calories from fat, not the other way around. 0 B. The regression model was for predicting fat from calories, not the other way around. 0 C. The regression model cannot extrapolate to the prediction value. b) Using an appropriate model, estimate the fat content of a burger with 600 calories. Fa: 14.052 + 0.077 x Calories (Round to three decimal places as needed.) The fat content of a burger with 600 calories is grams. (Round to one decimal place as needed.) D Tell what each of the residual plots to the right indicates about the appropriateness of the linear model that was t to the data. ,0 Q (h) e Residuals Residuals Reslduals (a) Choose the best answer for residuals plot (a). O A. The scattered residuals plot indicates an appropriate linear model. 0 B. The fanned pattern indicates that the linear model is not appropriate. The model's predicting power decreases as the values of the explanatory variable increases. 0 C. The curved pattern in the residuals plot indicates that the linear model is not appropriate. The relationship is not linear. (b) Choose the best answer for residuals plot (b). O A. The scattered residuals plot indicates an appropriate linear model. 0 B. The residual plot indicates that most of the data fall roughly along a straight line, with the exception of a single point. 0 C. The fanned pattern indicates that the linear model is not appropriate. The model's predicting power decreases as the values of the explanatory variable increases. (c) Choose the best answer for residuals plot (6). O A. The fanned pattern indicates that the linear model is not appropriate. The model's predicting power decreases as the values of the explanatory variable increases. 0 B. The fanned pattern indicates that the linear model is not appropriate. The model's predicting power increases as the values of the explanatory variable increases. 0 C. The scattered residuals plot indicates an appropriate linear model. Use the advertised prices for used cars of a particular model in the accompanying table to create a linear model for the relationship between a car's Age and its Price. Complete parts a through 9. E Click the icon to view the data table. a) Find the equation of the line of regression. 0 Data Table A Price = 17,599 +( ) Age (Round to the nearest integer as needed.) Price Advertised (S) a 1 7,599 1 5,008 1 5,989 1 3,968 14,969 1 4,6 1 9 b) Explain the meaning of the slope of the line. Select the correct choice below and ll in the answer box to complete your choice. (Round to the nearest integer as needed.) O A- The slope indicates that every $1 increase in Price increases the Age of cars of this model by year(s), on average. O B The slope indicates that every $1 increase in Price decreases the Age of cars of this model by year(s), on average 14,018 12,008 10,009 11,559 10,848 10,929 10,018 (9 C. The slope indicates that every 1-year increase in Age decreases the Price of cars of this model by $ , on average. O D- The slope indicates that every 1-year increase in Age increases the Price of cars of this model by $ , on average. A'DNNNQOUIO'I-hmnd c) Explain the meaning of the yintercept of the line. Select the correct choice below and ll in the answer box to complete your choice. (Round to the nearest integer as needed.) O A- The y-intercept indicates that every $1 increase in Price decreases the Age of cars of this model by year(s), on average. Print Done 0 B- The y-intercept indicates that every 1-year increase in Age decreases the Price of cars of this model by $ , on average. O C. The y-interoept means that a car of this model that costs $0 is year(s) old, on average. (9 D- The y-interoept means that a new car of this model costs $ , on average. d) If you want to sell a 7-year-old car of this model, what price seems appropriate? dollars (Round to the nearest dollar as needed.) e) You have a chance to buy one of two cars. They are about the same age and appear to be in equally good condition. Would you rather buy the one with a positive residual or the one with a negative residual? Explain. O A. The car with a positive residual is better because its actual price is below the predicted price for its age. 0 B. The car with a positive residual is better because its actual price is above the predicted price for its age. 0 Data Table C. The car with a negative residual is better because its actual price is below the predicted price for its age. O D. The car with a negative residual is better because its actual price is above the predicted price for its age. Price Advertised (S) 9 17,599 15,008 15,989 13,968 14,969 14,619 f) You see a "For Sale" sign on a 12-year-old car of this model stating the asking price as $9,100. What is the residual? dollar(s) (Round to the nearest dollar as needed.) 9) Would this regression model be useful in establishing a fair price for a 26-year-old car'? Explain. 14,018 12,008 10,009 11,559 10,848 10,929 10,018 A. No, because the predicted price is negative, which does not make sense. 0 B. No, because the predicted price is too high to be reasonable. 0 C. Yes, because the predicted price is positive and close to $0. AmeNmmmthNx _' O D. No, because the predicted price is $0, which does not make sense. Click to select your answer(s). Print Done
Step by Step Solution
There are 3 Steps involved in it

Get step-by-step solutions from verified subject matter experts