

Question: solve the question Consider the data in Exercise 1.5 on page 13. Compute the sample variance and the sample standard deviation for both control and
solve the question


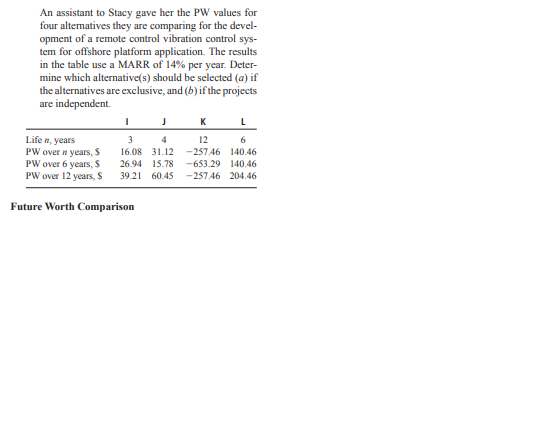
Consider the data in Exercise 1.5 on page 13. Compute the sample variance and the sample standard deviation for both control and treatment groups. Reference Exercise 1.5: Twenty adult males between the ages of 30 and 40 participated in a study to evaluate the effect of a specific health regimen involving diet and exercise on the blood cholesterol. Ten were randomly selected to be a control group, and ten others were assigned to take part in the regimen as the treatment group for a period of 6 months. The following data show the reduction in cholesterol experienced for the time period for the 20 subjects: Control group: 7 3 -4 14 2 522 -7 95 Treatment group: -6 5 9 4 4 12 37 5 3 3 (a) Do a dot plot of the data for both groups on the same graph. (b) Compute the mean, median, and 10% trimmed mean for both groups. (c) Explain why the difference in means suggests one conclusion about the effect of the regimen, while the difference in medians or trimmed means suggests a different conclusion.Consider the drying time data for Exercise 1.1 on page 13. Compute the sample variance and sample standard deviation. Reference: Exercise 1.1 The following measurements were recorded for the drying tine. in hours. of a certain brand of latex pa'nt. 3.4 2.5 4.8 2.9 3.6 2.8 3.3 5.5 3.? 2.3 4.4 4.0 5.2 3.0 4.3 Assume that the measurements are a simple random sample. {a} What is the sample size for the above sample? {In} Calculate the sample mean for these data. {c} Calculate the sample median. {djl Plot the data by way of a dot plot. {e} Compute the 20% trirm'ned mean for the above data set. { Is the sample mean for these data more or less descriptive as a center of location than the trimmed mean? A certain polymer is used for evacuation systems for aircraft. It is important that the polymer be resistant to the aging process. Twenty specimens of the polymer were used in an experiment. Ten were assigned randomly to be exposed to an accelerated batch aging process that involved exposure to high temperatures for 10 days. Measurements of tensile strength of the specimens were made, and the following data were recorded on tensile strength in psi: No aging: 227 222 218 217 225 218 216 229 228 221 Aging: 219 214 215 211 209 218 203 204 201 205 (a) Do a dot plot of the data. (b) From your plot, does it appear as if the aging process has had an effect on the tensile strength of thispolymer? Explain. (c) Calculate the sample mean tensile strength of the two samples. (d) Calculate the median for both. Discuss the similarity or lack of similarity between the mean andmedian of each group.An engineer is considering two different liners for an evaporation pond that will receive salty concentrate from a brackish water desalting plant. A plastic liner will cost $0.90 per square foot initially and will require replacement in 15 years when precipitated solids will have to be removed from the pond using heavy equipment. This removal will cost $500,000. A rubberized elastomeric liner is tougher and, there- fore, is expected to last 30 years, but it will cost $2 20 per square foot. If the size of the pond is 110 acres (1 acre = 43,560 square feet), which liner is more cost effective on the basis of a present worth comparison at an interest rate of 8% per year?An assistant to Stacy gave her the PW values for four alternatives they are comparing for the devel- opment of a remote control vibration control sys- tem for offshore platform application. The results in the table use a MARR of 14% per year. Deter- mine which alternative(s) should be selected (a) if the alternatives are exclusive, and (b) if the projects are independent. K Life n, years 3 12 6 PW over a years, $ 16/08 31.12 -257.46 140.46 PW over 6 years, $ 26.94 15.78 -653.29 140.46 PW over 12 years, $ 39.21 60.45 -257.46 204.46 Future Worth Comparison\f
Step by Step Solution
There are 3 Steps involved in it

Get step-by-step solutions from verified subject matter experts