

Question: solve the question Consider the data in Exercise 1.5 on page 13. Compute the sample variance and the sample standard deviation for both control and
solve the question
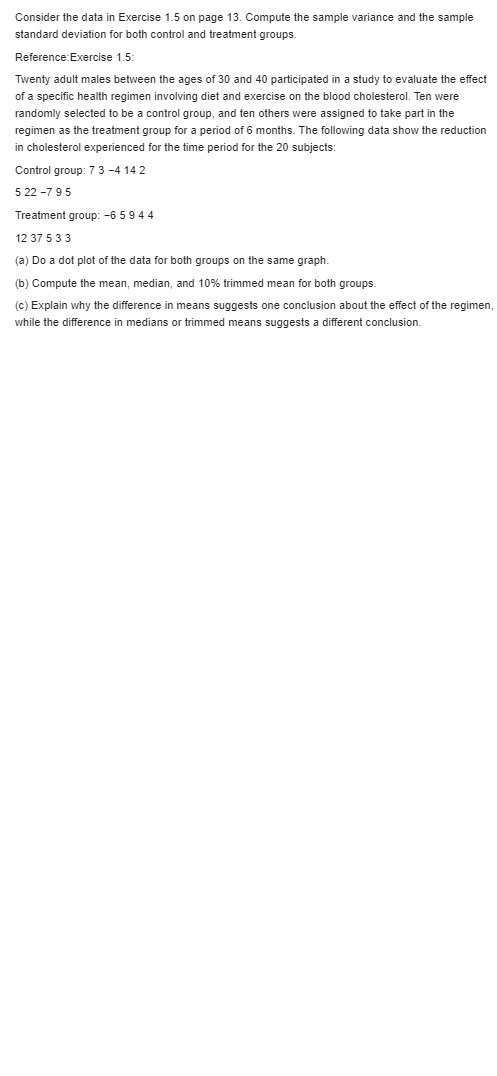
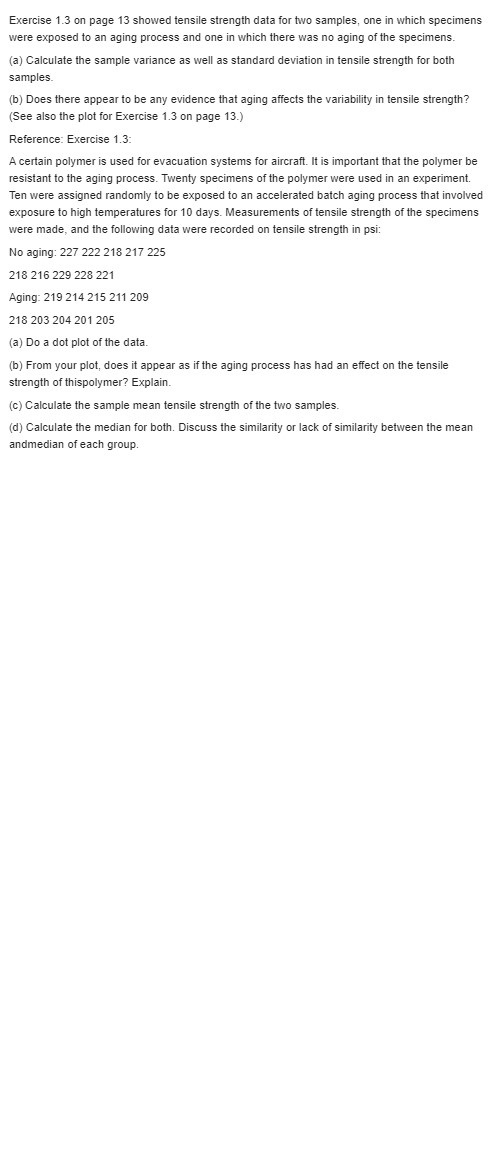
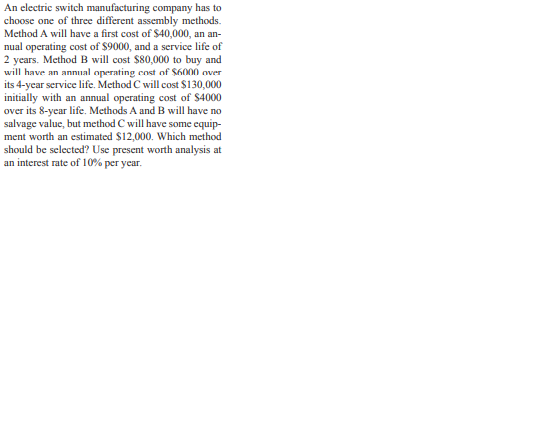
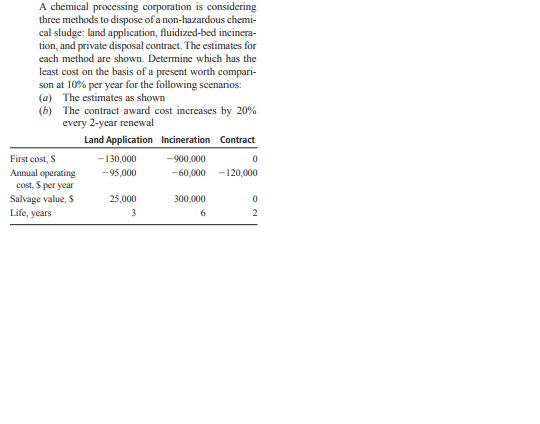
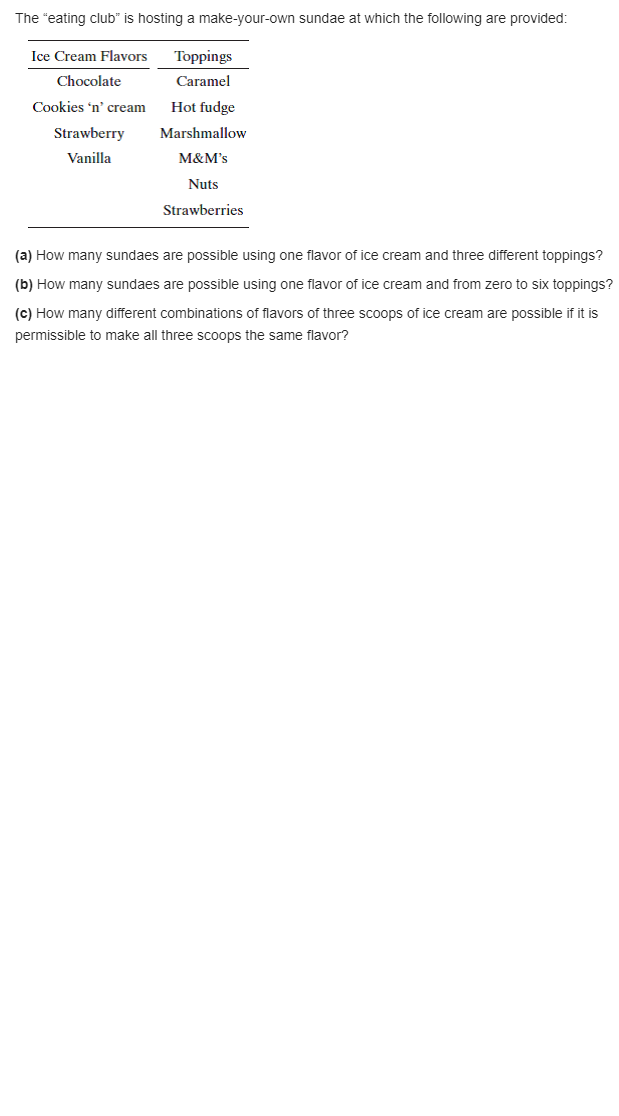
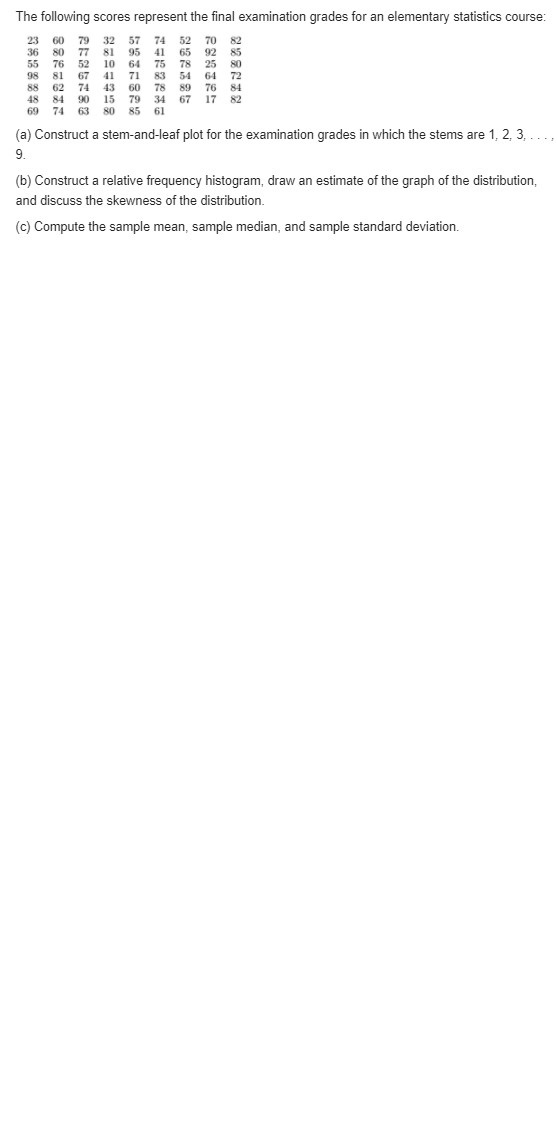
Consider the data in Exercise 1.5 on page 13. Compute the sample variance and the sample standard deviation for both control and treatment groups. Reference Exercise 1.5: Twenty adult males between the ages of 30 and 40 participated in a study to evaluate the effect of a specific health regimen involving diet and exercise on the blood cholesterol. Ten were randomly selected to be a control group, and ten others were assigned to take part in the regimen as the treatment group for a period of 6 months. The following data show the reduction in cholesterol experienced for the time period for the 20 subjects: Control group: 7 3 -4 14 2 522 -7 95 Treatment group: -6 5 9 4 4 12 37 5 3 3 (a) Do a dot plot of the data for both groups on the same graph. (b) Compute the mean, median, and 10% trimmed mean for both groups. (c) Explain why the difference in means suggests one conclusion about the effect of the regimen, while the difference in medians or trimmed means suggests a different conclusion.Exercise 1.3 on page 13 showed tensile strength data for two samples, one in which specimens were exposed to an aging process and one in which there was no aging of the specimens. (a) Calculate the sample variance as well as standard deviation in tensile strength for both samples. (b) Does there appear to be any evidence that aging affects the variability in tensile strength? (See also the plot for Exercise 1.3 on page 13.) Reference: Exercise 1.3: A certain polymer is used for evacuation systems for aircraft. It is important that the polymer be resistant to the aging process. Twenty specimens of the polymer were used in an experiment. Ten were assigned randomly to be exposed to an accelerated batch aging process that involved exposure to high temperatures for 10 days. Measurements of tensile strength of the specimens were made, and the following data were recorded on tensile strength in psi: No aging: 227 222 218 217 225 218 216 229 228 221 Aging: 219 214 215 211 209 218 203 204 201 205 (a) Do a dot plot of the data. (b) From your plot, does it appear as if the aging process has had an effect on the tensile strength of thispolymer? Explain. (c) Calculate the sample mean tensile strength of the two samples. (d) Calculate the median for both. Discuss the similarity or lack of similarity between the mean andmedian of each group.An electric switch manufacturing company has to choose one of three different assembly methods. Method A will have a first cost of $40,000, an an- nual operating cost of $9000, and a service life of 2 years. Method B will cost $80,000 to buy and will have an annual operating cost of Sholl over its 4-year service life. Method C will cost $130,000 initially with an annual operating cost of $4000 over its 8-year life. Methods A and B will have no salvage value, but method C will have some equip- ment worth an estimated $12,000. Which method should be selected? Use present worth analysis at an interest rate of 10% per year.A chemical processing corporation is considering three methods to dispose of a non-hazardous chemi- cal sludge: land application, fluidized-bed incinera tion, and private disposal contract. The estimates for each method are shown. Determine which has the least cost on the basis of a present worth compari- son at 10% per year for the following scenarios: (a) The estimates as shown (b) The contract award cost increases by 20% every 2-year renewal Land Application Incinerator Contract First cost, $ -130,000 -900,000 Annual operating -95,000 -60,000 -120,000 cost, $ per year Salvage value, $ 25,000 300,000 Life, years 3\fThe following scores represent the final examination grades for an elementary statistics course: 60 32 57 74 70 54 64 89 76 48 67 17 69 74 80 85 (a) Construct a stem-and-leaf plot for the examination grades in which the stems are 1, 2, 3, 9 (b) Construct a relative frequency histogram, draw an estimate of the graph of the distribution, and discuss the skewness of the distribution. (c) Compute the sample mean, sample median, and sample standard deviation
Step by Step Solution
There are 3 Steps involved in it

Get step-by-step solutions from verified subject matter experts