

Question: solve them A fast-food restaurant operates both a drive-through facility and a walk-in facility. On a randomly selected day, let X and Y, respectively, be
solve them
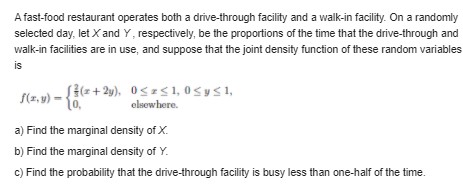
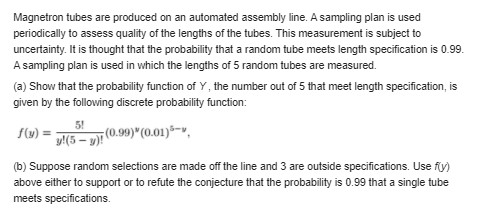
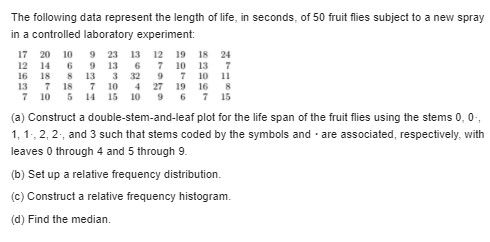
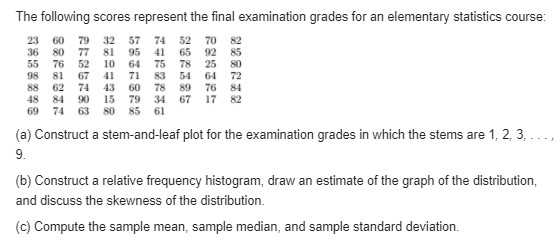
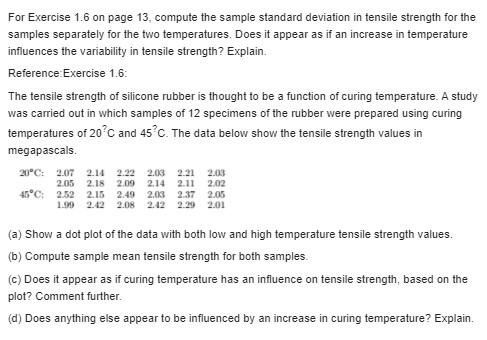
A fast-food restaurant operates both a drive-through facility and a walk-in facility. On a randomly selected day, let X and Y, respectively, be the proportions of the time that the drive-through and walk-in facilities are in use, and suppose that the joint density function of these random variables is f(z,y) = (x+2y). Ocxcl, Osys1, 10. alsowhere. a) Find the marginal density of X. b) Find the marginal density of Y. c) Find the probability that the drive-through facility is busy less than one-half of the time.Magnetron tubes are produced on an automated assembly line. A sampling plan is used periodically to assess quality of the lengths of the tubes. This measurement is subject to uncertainty. It is thought that the probability that a random tube meets length specification is 0.99. A sampling plan is used in which the lengths of 5 random tubes are measured. (a) Show that the probability function of Y , the number out of 5 that meet length specification, is given by the following discrete probability function: 5! f(y) y!(5 - y)! (0.99)" (0.01)5-, (b) Suppose random selections are made off the line and 3 are outside specifications. Use fly) above either to support or to refute the conjecture that the probability is 0.99 that a single tube meets specifications.\f\f\f\fThe following data represent the length of life, in seconds, of 50 fruit flies subject to a new spray in a controlled laboratory experiment: 17 20 In 13 12 19 18 24 12 14 10 13 7 16 18 13 32 T 10 11 13 7 10 4 19 16 R 7 10 5 14 15 10 9 6 15 (a) Construct a double-stem-and-leaf plot for the life span of the fruit flies using the stems 0, 0-, 1, 1., 2, 2, and 3 such that stems coded by the symbols and . are associated, respectively, with leaves 0 through 4 and 5 through 9. (b) Set up a relative frequency distribution. (c) Construct a relative frequency histogram. (d) Find the median.The following scores represent the final examination grades for an elementary statistics course: 23 60 79 32 57 74 52 82 36 80 81 95 41 65 92 85 55 76 52 10 64 75 78 98 81 67 71 83 54 64 88 62 74 43 60 78 89 76 48 90 15 79 34 67 121 69 63 80 85 61 (a) Construct a stem-and-leaf plot for the examination grades in which the stems are 1, 2, 3, ... 9. (b) Construct a relative frequency histogram, draw an estimate of the graph of the distribution, and discuss the skewness of the distribution. (c) Compute the sample mean, sample median, and sample standard deviation.For Exercise 1.6 on page 13, compute the sample standard deviation in tensile strength for the samples separately for the two temperatures. Does it appear as if an increase in temperature influences the variability in tensile strength? Explain. Reference Exercise 1.6: The tensile strength of silicone rubber is thought to be a function of curing temperature. A study was carried out in which samples of 12 specimens of the rubber were prepared using curing temperatures of 20 C and 45 C. The data below show the tensile strength values in megapascals. 20"C: 2.07 2.14 2.22 2.03 2.21 2.013 2.05 2.18 2.09 2.14 2.11 2.02 45"C: 2.52 2.15 2.49 2.03 2.37 2.05 2.42 2.08 2.42 2.20 2.01 (a) Show a dot plot of the data with both low and high temperature tensile strength values. (b) Compute sample mean tensile strength for both samples. (c) Does it appear as if curing temperature has an influence on tensile strength, based on the plot? Comment further. (d) Does anything else appear to be influenced by an increase in curing temperature? Explain
Step by Step Solution
There are 3 Steps involved in it

Get step-by-step solutions from verified subject matter experts