

Question: solve these practice problems An important factor in solid missile fuel is the particle size distribution. Significant problems occur if the particle sizes are too
solve these practice problems
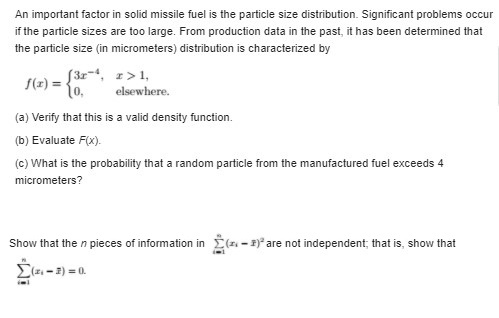
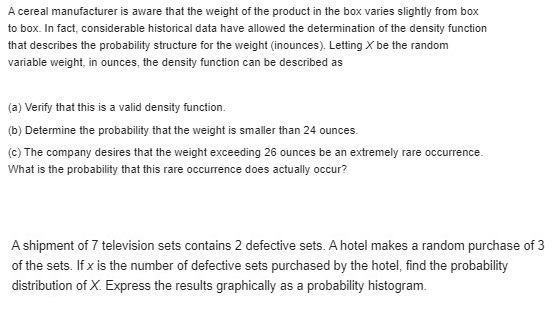

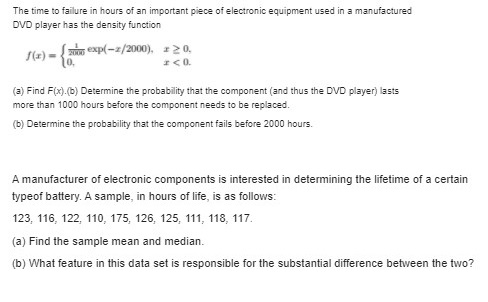
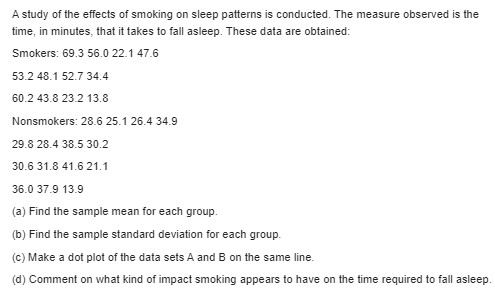
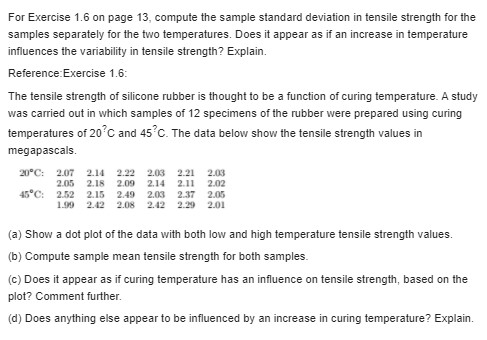
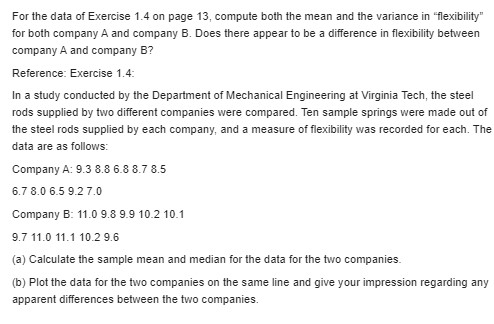
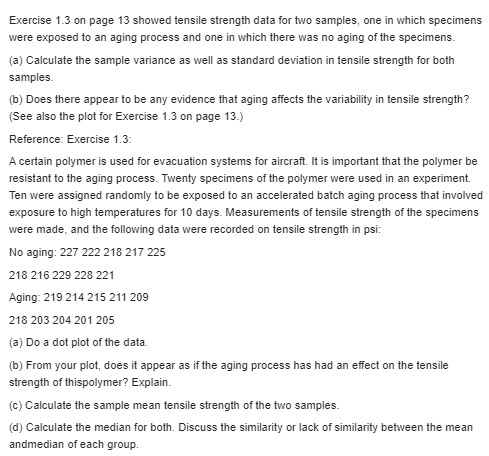
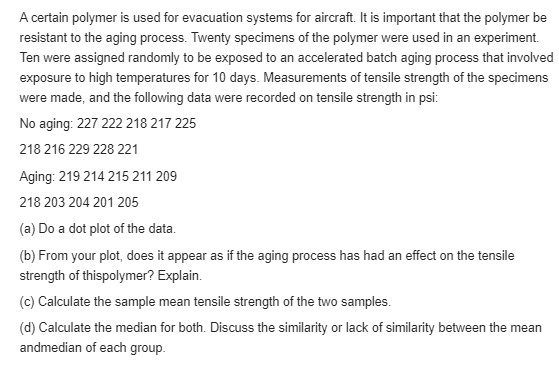
An important factor in solid missile fuel is the particle size distribution. Significant problems occur if the particle sizes are too large. From production data in the past, it has been determined that the particle size (in micrometers) distribution is characterized by (3r , :>1, f(z) = 10. elsewhere. (a) Verify that this is a valid density function. (b) Evaluate F(x). (c) What is the probability that a random particle from the manufactured fuel exceeds 4 micrometers? Show that the n pieces of information in _ (x -") are not independent; that is, show that S(n-1)=0A cereal manufacturer is aware that the weight of the product in the box varies slightly from box to box. In fact, considerable historical data have allowed the determination of the density function that describes the probability structure for the weight (inounces). Letting X be the random variable weight, in ounces, the density function can be described as (a) Verify that this is a valid density function. (b) Determine the probability that the weight is smaller than 24 ounces. (c) The company desires that the weight exceeding 26 ounces be an extremely rare occurrence. What is the probability that this rare occurrence does actually occur? A shipment of 7 television sets contains 2 defective sets. A hotel makes a random purchase of 3 of the sets. If x is the number of defective sets purchased by the hotel, find the probability distribution of X. Express the results graphically as a probability histogram.A fast-food restaurant operates both a drive-through facility and a walk-in facility. On a randomly selected day, let X and Y, respectively, be the proportions of the time that the drive-through and walk-in facilities are in use, and suppose that the joint density function of these random variables is f(z,y) = (x+2y). Ocxcl, Osys1, 10. alsowhere. a) Find the marginal density of X. b) Find the marginal density of Y. c) Find the probability that the drive-through facility is busy less than one-half of the time.\fThe time to failure in hours of an important piece of electronic equipment used in a manufactured DVD player has the density function (x) 3005 xp(-2/2000), a 2 0. (3) Find F(x).(b) Determine the probability that the component (and thus the DVD player) lasts more than 1000 hours before the component needs to be replaced. (b) Determine the probability that the component fails before 2000 hours. A manufacturer of electronic components is interested in determining the lifetime of a certain typeof battery. A sample, in hours of life, is as follows: 123, 116, 122, 110, 175, 126, 125, 111, 118, 117. (a) Find the sample mean and median. (b) What feature in this data set is responsible for the substantial difference between the two?A study of the effects of smoking on sleep patterns is conducted. The measure observed is the time, in minutes, that it takes to fall asleep. These data are obtained: Smokers: 69.3 56.0 22.1 47.6 53.2 48.1 52.7 34.4 60.2 43.8 23.2 13.8 Nonsmokers: 28.6 25.1 26.4 34.9 29.8 28.4 38.5 30.2 30.6 31.8 41.6 21.1 36.0 37.9 13.9 (a) Find the sample mean for each group. (b) Find the sample standard deviation for each group. (c) Make a dot plot of the data sets A and B on the same line. (d) Comment on what kind of impact smoking appears to have on the time required to fall asleep.For Exercise 1.6 on page 13, compute the sample standard deviation in tensile strength for the samples separately for the two temperatures. Does it appear as if an increase in temperature influences the variability in tensile strength? Explain. Reference Exercise 1.6: The tensile strength of silicone rubber is thought to be a function of curing temperature. A study was carried out in which samples of 12 specimens of the rubber were prepared using curing temperatures of 20 C and 45 C. The data below show the tensile strength values in megapascals. 20"C: 2.07 2.14 2.22 2.03 2.21 2.013 2.05 2.18 2.09 2.14 2.11 2.02 45"C: 2.52 2.15 2.49 2.03 2.37 2.05 2.42 2.08 2.42 2.20 2.01 (a) Show a dot plot of the data with both low and high temperature tensile strength values. (b) Compute sample mean tensile strength for both samples. (c) Does it appear as if curing temperature has an influence on tensile strength, based on the plot? Comment further. (d) Does anything else appear to be influenced by an increase in curing temperature? Explain.For the data of Exercise 1.4 on page 13, compute both the mean and the variance in "flexibility" for both company A and company B. Does there appear to be a difference in flexibility between company A and company B? Reference: Exercise 1.4: In a study conducted by the Department of Mechanical Engineering at Virginia Tech, the steel rods supplied by two different companies were compared. Ten sample springs were made out of the steel rods supplied by each company, and a measure of flexibility was recorded for each. The data are as follows: Company A: 9.3 8.8 6.8 8.7 8.5 6.7 8.0 6.59.27.0 Company B: 11.0 9.8 9.9 10.2 10.1 9.7 11.0 11.1 10.2 9.6 (a) Calculate the sample mean and median for the data for the two companies. (b) Plot the data for the two companies on the same line and give your impression regarding any apparent differences between the two companies.Exercise 1.3 on page 13 showed tensile strength data for two samples, one in which specimens were exposed to an aging process and one in which there was no aging of the specimens. (a) Calculate the sample variance as well as standard deviation in tensile strength for both samples. (b) Does there appear to be any evidence that aging affects the variability in tensile strength? (See also the plot for Exercise 1.3 on page 13.) Reference: Exercise 1.3: A certain polymer is used for evacuation systems for aircraft. It is important that the polymer be resistant to the aging process. Twenty specimens of the polymer were used in an experiment. Ten were assigned randomly to be exposed to an accelerated batch aging process that involved exposure to high temperatures for 10 days. Measurements of tensile strength of the specimens were made, and the following data were recorded on tensile strength in psi: No aging: 227 222 218 217 225 218 216 229 228 221 Aging: 219 214 215 211 209 218 203 204 201 205 (a) Do a dot plot of the data. (b) From your plot, does it appear as if the aging process has had an effect on the tensile strength of thispolymer? Explain. (c) Calculate the sample mean tensile strength of the two samples. (d) Calculate the median for both. Discuss the similarity or lack of similarity between the mean andmedian of each group.A certain polymer is used for evacuation systems for aircraft. It is important that the polymer be resistant to the aging process. Twenty specimens of the polymer were used in an experiment. Ten were assigned randomly to be exposed to an accelerated batch aging process that involved exposure to high temperatures for 10 days. Measurements of tensile strength of the specimens were made, and the following data were recorded on tensile strength in psi: No aging: 227 222 218 217 225 218 216 229 228 221 Aging: 219 214 215 211 209 218 203 204 201 205 (a) Do a dot plot of the data. (b) From your plot, does it appear as if the aging process has had an effect on the tensile strength of thispolymer? Explain. (c) Calculate the sample mean tensile strength of the two samples. (d) Calculate the median for both. Discuss the similarity or lack of similarity between the mean andmedian of each group
Step by Step Solution
There are 3 Steps involved in it

Get step-by-step solutions from verified subject matter experts