

Question: solve these practice problems The relative conductivity of a semiconductor device is determined by the amount of impurity doped into the device during its manufacture.
solve these practice problems
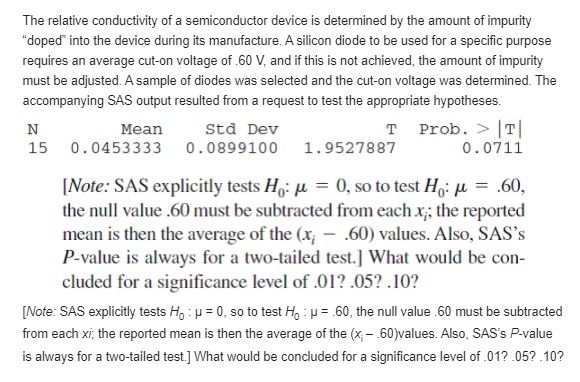
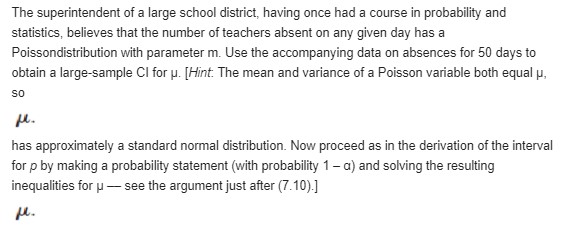
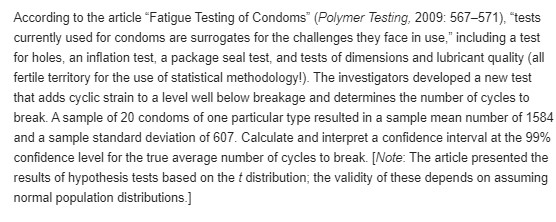
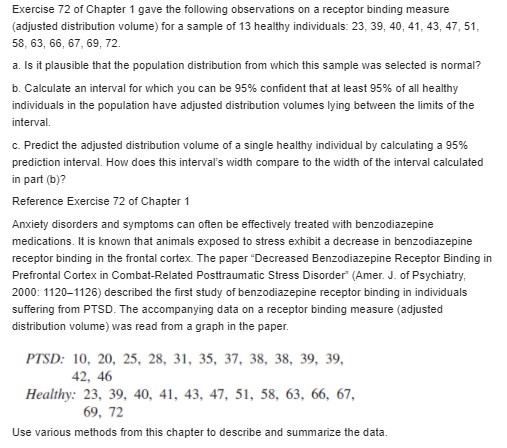
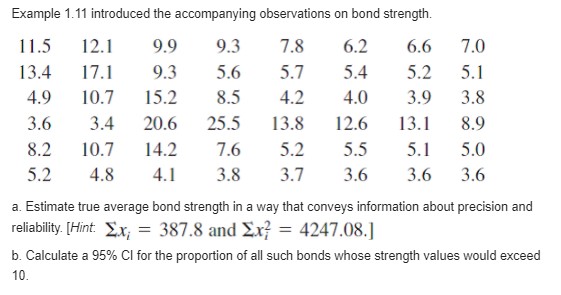
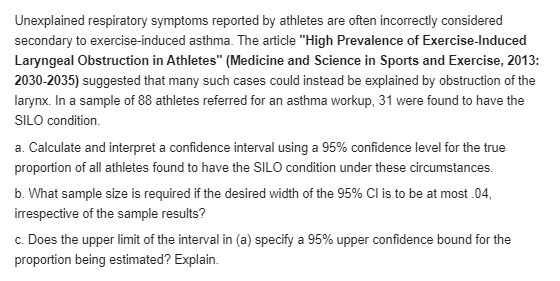
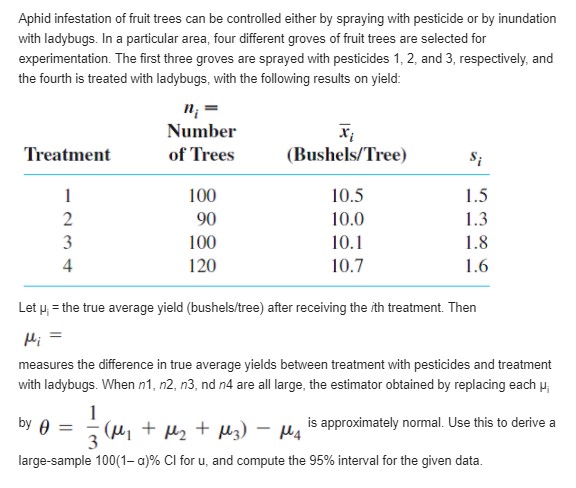
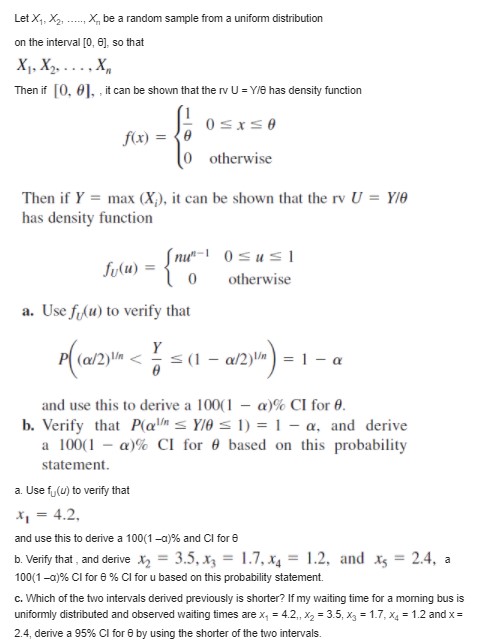
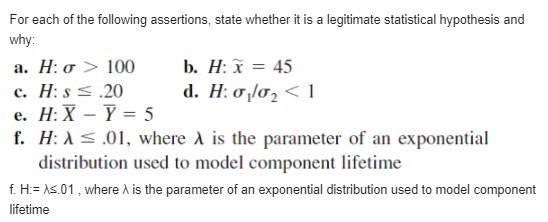
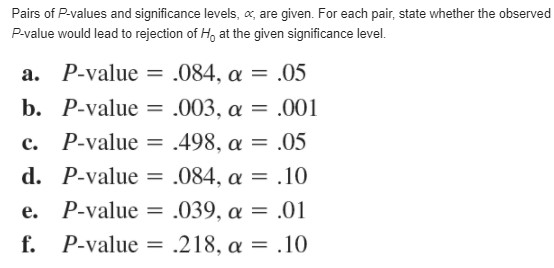
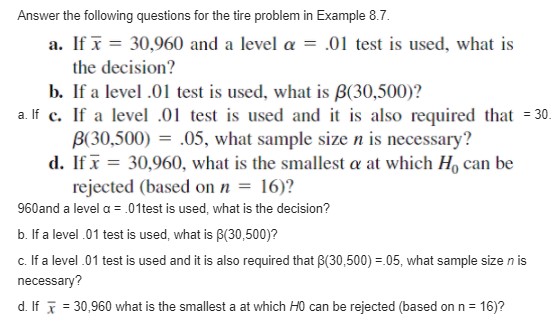
The relative conductivity of a semiconductor device is determined by the amount of impurity "doped" into the device during its manufacture. A silicon diode to be used for a specific purpose requires an average cut-on voltage of .60 V, and if this is not achieved, the amount of impurity must be adjusted. A sample of diodes was selected and the cut-on voltage was determined. The accompanying SAS output resulted from a request to test the appropriate hypotheses. N Mean Std Dev T Prob. > T 15 0.0453333 0.0899100 1.9527887 0 . 0711 [Note: SAS explicitly tests Ho: u = 0, so to test H: u = .60, the null value .60 must be subtracted from each x ; the reported mean is then the average of the (x; - .60) values. Also, SAS's P-value is always for a two-tailed test.] What would be con- cluded for a significance level of .01? .05? .10? [Note: SAS explicitly tests Ho : p = 0, so to test Ho : p = .60, the null value .60 must be subtracted from each xi; the reported mean is then the average of the (x - .60)values. Also, SAS's P-value is always for a two-tailed test.] What would be concluded for a significance level of .01? .05? .10?The superintendent of a large school district, having once had a course in probability and statistics, believes that the number of teachers absent on any given day has a Poissondistribution with parameter m. Use the accompanying data on absences for 50 days to obtain a large-sample CI for p. [Hint: The mean and variance of a Poisson variable both equal p, SO has approximately a standard normal distribution. Now proceed as in the derivation of the interval for p by making a probability statement (with probability 1 - a) and solving the resulting inequalities for p - see the argument just after (7.10).]According to the article "Fatigue Testing of Condoms" (Polymer Testing, 2009: 567-571), "tests currently used for condoms are surrogates for the challenges they face in use," including a test for holes, an inflation test, a package seal test, and tests of dimensions and lubricant quality (all fertile territory for the use of statistical methodology!). The investigators developed a new test that adds cyclic strain to a level well below breakage and determines the number of cycles to break. A sample of 20 condoms of one particular type resulted in a sample mean number of 1584 and a sample standard deviation of 607. Calculate and interpret a confidence interval at the 99% confidence level for the true average number of cycles to break. [Note: The article presented the results of hypothesis tests based on the t distribution; the validity of these depends on assuming normal population distributions.]Exercise 72 of Chapter 1 gave the following observations on a receptor binding measure (adjusted distribution volume) for a sample of 13 healthy individuals: 23, 39, 40, 41, 43, 47, 51, 58, 63, 66, 67, 69, 72. a. Is it plausible that the population distribution from which this sample was selected is normal? b. Calculate an interval for which you can be 95% confident that at least 95% of all healthy individuals in the population have adjusted distribution volumes lying between the limits of the interval. c. Predict the adjusted distribution volume of a single healthy individual by calculating a 95% prediction interval. How does this interval's width compare to the width of the interval calculated in part (b)? Reference Exercise 72 of Chapter 1 Anxiety disorders and symptoms can often be effectively treated with benzodiazepine medications. It is known that animals exposed to stress exhibit a decrease in benzodiazepine receptor binding in the frontal cortex. The paper "Decreased Benzodiazepine Receptor Binding in Prefrontal Cortex in Combat-Related Posttraumatic Stress Disorder" (Amer. J. of Psychiatry, 2000: 1120-1126) described the first study of benzodiazepine receptor binding in individuals suffering from PTSD. The accompanying data on a receptor binding measure (adjusted distribution volume) was read from a graph in the paper. PTSD: 10, 20, 25, 28, 31, 35, 37, 38, 38, 39, 39, 42. 46 Healthy: 23, 39, 40, 41, 43, 47, 51, 58, 63, 66. 67, 69. 72 Use various methods from this chapter to describe and summarize the data.Example 1.11 introduced the accompanying observations on bond strength. 11.5 12.1 9.9 9.3 7.8 6.2 6.6 7.0 13.4 17.1 9.3 5.6 5.7 5.4 5.2 5.1 4.9 10.7 15.2 8.5 4.2 4.0 3.9 3.8 3.6 3.4 20.6 25.5 13.8 12.6 13.1 8.9 8.2 10.7 14.2 7.6 5.2 5.5 5.1 5.0 5.2 4.8 4.1 3.8 3.7 3.6 3.6 3.6 a. Estimate true average bond strength in a way that conveys information about precision and reliability. [Hint: Ex; = 387.8 and Ex? = 4247.08.] b. Calculate a 95% Cl for the proportion of all such bonds whose strength values would exceed 10.Unexplained respiratory symptoms reported by athletes are often incorrectly considered secondary to exercise-induced asthma. The article "High Prevalence of Exercise-Induced Laryngeal Obstruction in Athletes" (Medicine and Science in Sports and Exercise, 2013: 2030-2035) suggested that many such cases could instead be explained by obstruction of the larynx. In a sample of 88 athletes referred for an asthma workup, 31 were found to have the SILO condition. a. Calculate and interpret a confidence interval using a 95% confidence level for the true proportion of all athletes found to have the SILO condition under these circumstances. b. What sample size is required if the desired width of the 95% Cl is to be at most .04, irrespective of the sample results? c. Does the upper limit of the interval in (a) specify a 95% upper confidence bound for the proportion being estimated? Explain.Aphid infestation of fruit trees can be controlled either by spraying with pesticide or by inundation with ladybugs. In a particular area, four different groves of fruit trees are selected for experimentation. The first three groves are sprayed with pesticides 1, 2, and 3, respectively, and the fourth is treated with ladybugs, with the following results on yield: 1; = Number Treatment of Trees (Bushels/Tree) S; 100 10.5 1.5 90 10.0 1.3 A UN- 100 10.1 1.8 120 10.7 1.6 Let p; = the true average yield (bushels/tree) after receiving the ith treatment. Then measures the difference in true average yields between treatment with pesticides and treatment with ladybugs. When n1, n2, n3, nd n4 are all large, the estimator obtained by replacing each ; by A = 7 ( M, + My + us) - u, is approximately normal. Use this to derive a large-sample 100(1-a)% Cl for u, and compute the 95% interval for the given data.Let X1, X2, ..., X, be a random sample from a uniform distribution on the interval [0, 0], so that X1, X2. . . . . X, Then if [O, 0], , it can be shown that the rv U = Y/0 has density function f(x) = O otherwise Then if Y = max (X,), it can be shown that the rv U = Y/0 has density function Sulu) = n"! OSuEl lo otherwise a. Use flu) to verify that P( (@/2) In 100 b. H: x = 45 c. H: s = .20 d. H: o/02 - 1 e. H: X - Y = 5 f. H: A = .01, where A is the parameter of an exponential distribution used to model component lifetime f. H:= As.01 , where A is the parameter of an exponential distribution used to model component lifetimePairs of P-values and significance levels, a are given. For each pair, state whether the observed P-value would lead to rejection of Ho at the given significance level. a. P-value = .084, a = .05 b. P-value = .003, a = .001 c. P-value = .498, a = .05 d. P-value = .084, a = .10 e. P-value = .039, a = .01 f. P-value = .218, a = .10Answer the following questions for the tire problem in Example 8.7. a. If x = 30,960 and a level a = .01 test is used, what is the decision? b. If a level .01 test is used, what is B(30,500)? a. If c. If a level .01 test is used and it is also required that = 30. B(30,500) = .05, what sample size n is necessary? d. If x = 30,960, what is the smallest o at which Ho can be rejected (based on n = 16)? 960and a level a = .01test is used, what is the decision? b. If a level .01 test is used, what is B(30,500)? c. If a level .01 test is used and it is also required that B(30,500) =.05, what sample size n is necessary? d. If x = 30,960 what is the smallest a at which /0 can be rejected (based on n = 16)
Step by Step Solution
There are 3 Steps involved in it

Get step-by-step solutions from verified subject matter experts