

Question: Solve these questions. A restaurant faces very high demand for its signature mousse desserts in the evening but is less busy during the day. Its

Solve these questions.
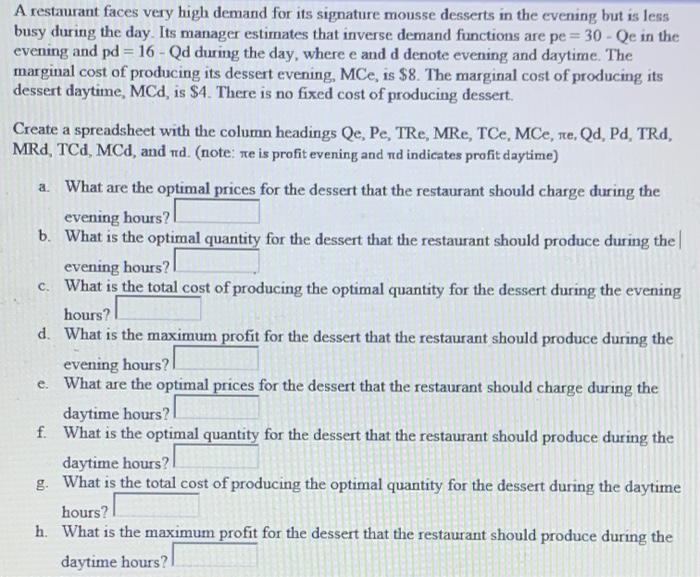
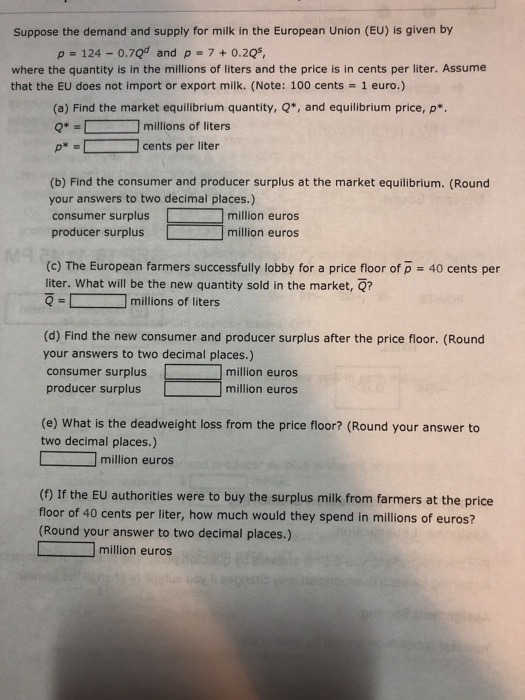
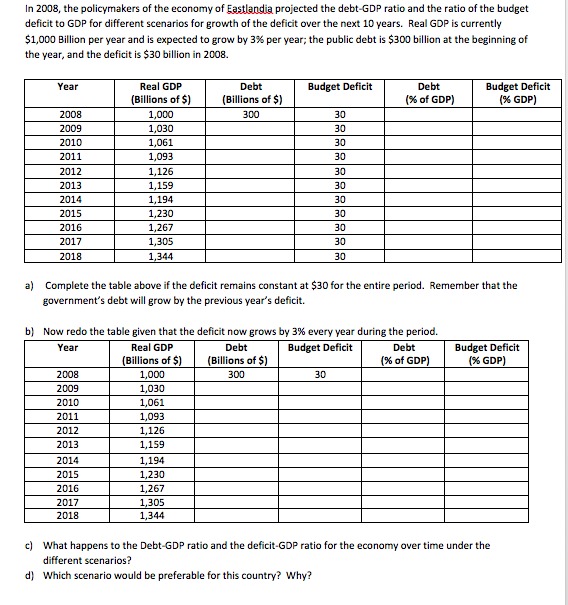
A restaurant faces very high demand for its signature mousse desserts in the evening but is less busy during the day. Its manager estimates that inverse demand functions are pe = 30 - Qe in the evening and pd = 16 -Qd during the day, where e and d denote evening and daytime. The marginal cost of producing its dessert evening, MCe, is $8. The marginal cost of producing its dessert daytime, MCd, is $4. There is no fixed cost of producing dessert. Create a spreadsheet with the column headings Qe, Pe, TRe, MRe, TCe, MCe, ne, Qd, Pd, TRd, MRd, TCd, MCd, and nd. (note: ne is profit evening and nd indicates profit daytime) a. What are the optimal prices for the dessert that the restaurant should charge during the evening hours? b. What is the optimal quantity for the dessert that the restaurant should produce during the evening hours? c. What is the total cost of producing the optimal quantity for the dessert during the evening hours? d. What is the maximum profit for the dessert that the restaurant should produce during the evening hours? e. What are the optimal prices for the dessert that the restaurant should charge during the daytime hours? f. What is the optimal quantity for the dessert that the restaurant should produce during the daytime hours? I g. What is the total cost of producing the optimal quantity for the dessert during the daytime hours? h. What is the maximum profit for the dessert that the restaurant should produce during the daytime hours?Suppose the demand and supply for milk in the European Union (EU) is given by p = 124 - 0.7Q" and p = 7 + 0.2Q5, where the quantity is in the millions of liters and the price is in cents per liter, Assume that the EU does not import or export milk. (Note: 100 cents = 1 euro.) (a) Find the market equilibrium quantity, Q*, and equilibrium price, p*. millions of liters cents per liter (b) Find the consumer and producer surplus at the market equilibrium. (Round your answers to two decimal places.) consumer surplus million euros producer surplus million euros (c) The European farmers successfully lobby for a price floor of p = 40 cents per liter. What will be the new quantity sold in the market, Q? Q =[ millions of liters (d) Find the new consumer and producer surplus after the price floor. (Round your answers to two decimal places.) consumer surplus million euros producer surplus million euros (e) What is the deadweight loss from the price floor? (Round your answer to two decimal places.) million euros (f) If the EU authorities were to buy the surplus milk from farmers at the price floor of 40 cents per liter, how much would they spend in millions of euros? (Round your answer to two decimal places.) million eurosIn 2008, the policymakers of the economy of Eastlandia projected the debt-GDP ratio and the ratio of the budget deficit to GDP for different scenarios for growth of the deficit over the next 10 years. Real GDP is currently $1,000 Billion per year and is expected to grow by 3% per year; the public debt is $300 billion at the beginning of the year, and the deficit is $30 billion in 2008 Year Real GDP Debt Budget Deficit Debt Budget Deficit Billions of $) Billions of $) % of GDP) (X GDP) 2008 1,000 300 30 200 1,030 30 2010 1,061 30 2011 1,093 DE 2012 1,126 30 2013 1,159 30 2014 1,194 30 2015 1,230 30 2016 1,267 30 2017 1,305 30 2018 1,344 30 ) Complete the table above if the deficit remains constant at $30 for the entire period. Remember that the government's debt will grow by the previous year's deficit. b) Now redo the table given that the deficit now grows by 3% every year during the period. Year Real GDP Deb Budget Deficit Debt Budget Deficit Billions of $) (Billions of $) (% of GDP) %% GDP) 2008 1,000 300 30 1009 1,030 2010 1,061 2011 1,093 2012 1,120 201 1,159 2014 1,194 2015 1,230 2016 1,267 2017 1,30 2018 1,344 c) What happens to the Debt-GDP ratio and the deficit-GDP ratio for the economy over time under the different scenarios? d) Which scenario would be preferable for this country? Why
Step by Step Solution
There are 3 Steps involved in it

Get step-by-step solutions from verified subject matter experts