

Question: solve this question clearly and correctly. solve the model using lingo. and answer the following questions correctly. A company produces 10 products in 7 different
solve this question clearly and correctly. solve the model using lingo. and answer the following questions correctly. 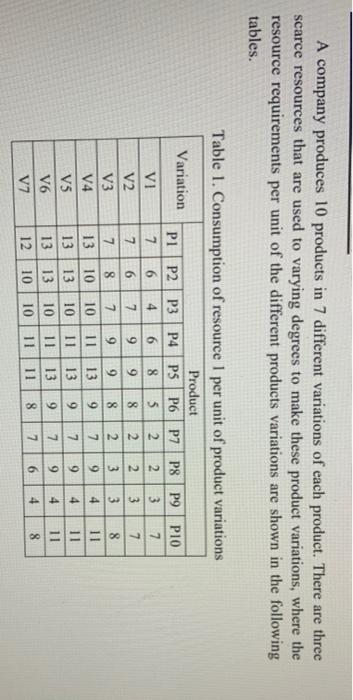
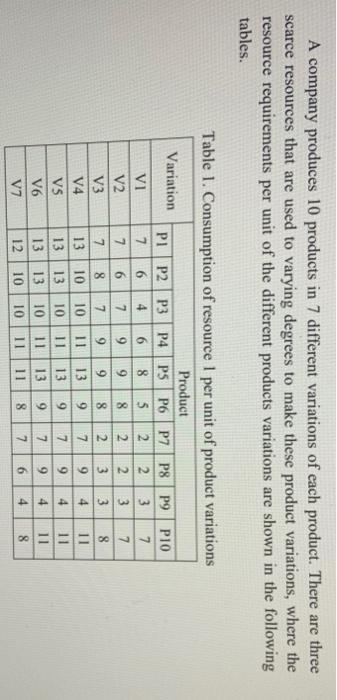
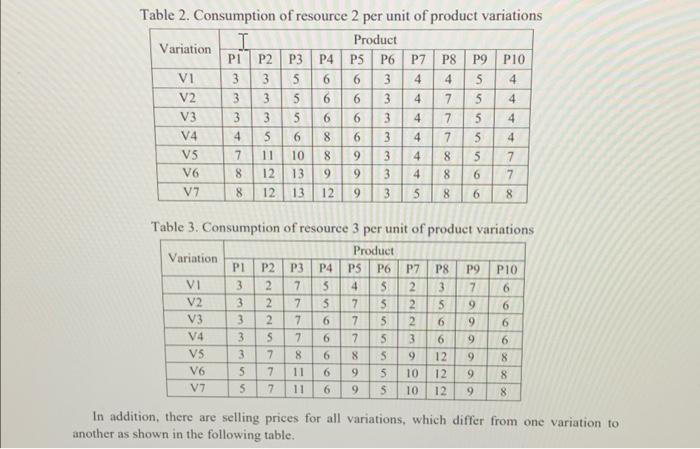
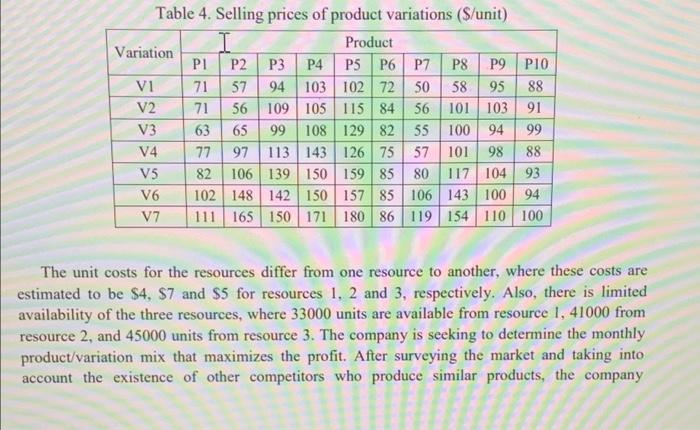
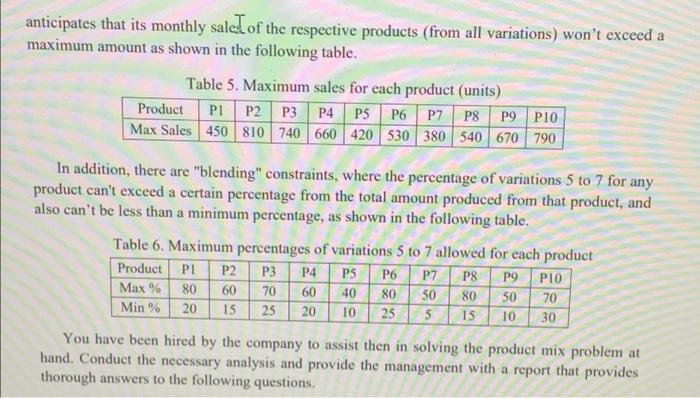
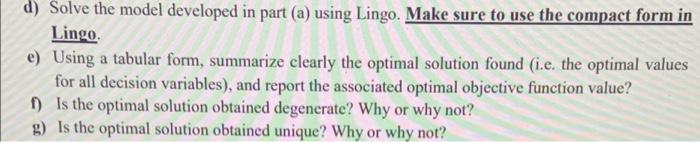
A company produces 10 products in 7 different variations of each product. There are three scarce resources that are used to varying degrees to make these product Variations, where the resource requirements per unit of the different products variations are shown in the following tables. os Table 1. Consumption of resource 1 per unit of product Variations Product Variation PI P2P3 P4 PSP6 P7 P8 P9 PIO Vi 7 6 4 6 8 5 2 2 3 7 V2 7 6 7 9 9 8 2 2 3 7 V3 7 8 7 9 9 8 2 3 3 8 V4 13 10 10 11 13 9 7 9 4 11 V5 13 | 13 10 11 13 7 9 4 11 V6 13 13 10 11 13 9 7 9 4 11 V7 12 10 10 11 11 8 7 6 4 8 0-100 A company produces 10 products in 7 different variations of each product. There are three scarce resources that are used to varying degrees to make these product variations, where the resource requirements per unit of the different products variations are shown in the following tables. Table 1. Consumption of resource 1 per unit of product variations Product Variation PI P2 P3 P4 PSP6 P7 P8 P9 P10 VI 7 6 4 6 8 5 2 2 3 7 V2 7 6 7 9 9 8 2 2 3 7 V3 7 8 7 9 9 8 2 3 3 8 V4 13 10 10 11 13 9 7 9 4 11 VS 13 13 10 11 13 9 7 9 4 11 V6 13 13 10 11 13 9 7 9 4 11 V7 12 10 10 11 11 8 7 6 4 8 00 Olo 0000 Table 2. Consumption of resource 2 per unit of product variations Variation I Product P1 P2 P3 P4 P5 P6 P7 P8 P9 P10 VI 3 3 5 6 6 3 4 4 5 4 V2 3 3 56 6 3 4 7 5 4 V3 3 3 5 6 6 3 4 7 5 4 V4 4 5 6 8 6 3 4 7 5 4 V5 7 10 8 9 3 4 8 5 7 V6 8 12 139 9 3 4 8 6 7 V7 8 12 13 12 9 3 5 8 6 8 5 I S 00 00 00 V2 Table 3. Consumption of resource 3 per unit of product variations Variation Product PI P2 P3 P4 PS P6 P7 P8 P9 P10 VI 3 2 7 5 4 S 2 3 7 6 3 2 7 5 7 5 2 5 9 6 V3 3 2 7 6 7 5 2 6 9 6 V4 3 5 7 6 7 5 3 6 9 6 VS 3 7 8 6 8 S 9 12 9 8 VG 5 7 11 6 9 5 10 12 9 8 V7 5 7 11 6 9 10 12 8 S cleic clocNNN OOO - 9 In addition, there are selling prices for all variations, which differ from one variation to another as shown in the following table. Table 4. Selling prices of product variations (S/unit) I Product Variation PI P2 P3 P4 P5 P6 P7 P8 P9 P10 vi 71 57 94 103 102 72 50 58 9588 V2 71 56 109 105 115 84 56 101 103 91 V3 63 65 99 108 129 82 55 100 94 99 V4 77 97 113 143 126 75 57 101 98 88 V5 82 106 139 150 159 85 80 117 104 93 V6 102 148 142 150 157 85 106 143 100 94 V7 111 165 150 171 180 86 119 154 110 100 The unit costs for the resources differ from one resource to another, where these costs are estimated to be $4. $7 and $5 for resources 1, 2 and 3, respectively. Also, there is limited availability of the three resources, where 33000 units are available from resource 1, 41000 from resource 2, and 45000 units from resource 3. The company is seeking to determine the monthly product/variation mix that maximizes the profit. After surveying the market and taking into account the existence of other competitors who produce similar products, the company anticipates that its monthly saled of the respective products (from all variations) won't exceed a maximum amount as shown in the following table. Table 5. Maximum sales for each product (units) Product PLP2 P3 P4 P5 P6 P7 P8 P9 P10 Max Sales 450 810 740 660 420 530 380 540 670 790 In addition, there are "blending" constraints, where the percentage of variations 5 to 7 for any product can't exceed a certain percentage from the total amount produced from that product, and also can't be less than a minimum percentage, as shown in the following table. Table 6. Maximum percentages of variations 5 to 7 allowed for each product Product PI P2 P3 P4 PS P6 P7 P8 P9 PIO. Max % 80 60 70 60 40 80 50 80 50 70 Min % 20 15 25 20 10 25 5 15 10 30 You have been hired by the company to assist then in solving the product mix problem at hand. Conduct the necessary analysis and provide the management with a report that provides thorough answers to the following questions. d) Solve the model developed in part (a) using Lingo. Make sure to use the compact form in Lingo e) Using a tabular form, summarize clearly the optimal solution found (i.e. the optimal values for all decision variables), and report the associated optimal objective function value? 1) Is the optimal solution obtained degenerate? Why or why not? g) Is the optimal solution obtained unique? Why or why not? A company produces 10 products in 7 different variations of each product. There are three scarce resources that are used to varying degrees to make these product Variations, where the resource requirements per unit of the different products variations are shown in the following tables. os Table 1. Consumption of resource 1 per unit of product Variations Product Variation PI P2P3 P4 PSP6 P7 P8 P9 PIO Vi 7 6 4 6 8 5 2 2 3 7 V2 7 6 7 9 9 8 2 2 3 7 V3 7 8 7 9 9 8 2 3 3 8 V4 13 10 10 11 13 9 7 9 4 11 V5 13 | 13 10 11 13 7 9 4 11 V6 13 13 10 11 13 9 7 9 4 11 V7 12 10 10 11 11 8 7 6 4 8 0-100 A company produces 10 products in 7 different variations of each product. There are three scarce resources that are used to varying degrees to make these product variations, where the resource requirements per unit of the different products variations are shown in the following tables. Table 1. Consumption of resource 1 per unit of product variations Product Variation PI P2 P3 P4 PSP6 P7 P8 P9 P10 VI 7 6 4 6 8 5 2 2 3 7 V2 7 6 7 9 9 8 2 2 3 7 V3 7 8 7 9 9 8 2 3 3 8 V4 13 10 10 11 13 9 7 9 4 11 VS 13 13 10 11 13 9 7 9 4 11 V6 13 13 10 11 13 9 7 9 4 11 V7 12 10 10 11 11 8 7 6 4 8 00 Olo 0000 Table 2. Consumption of resource 2 per unit of product variations Variation I Product P1 P2 P3 P4 P5 P6 P7 P8 P9 P10 VI 3 3 5 6 6 3 4 4 5 4 V2 3 3 56 6 3 4 7 5 4 V3 3 3 5 6 6 3 4 7 5 4 V4 4 5 6 8 6 3 4 7 5 4 V5 7 10 8 9 3 4 8 5 7 V6 8 12 139 9 3 4 8 6 7 V7 8 12 13 12 9 3 5 8 6 8 5 I S 00 00 00 V2 Table 3. Consumption of resource 3 per unit of product variations Variation Product PI P2 P3 P4 PS P6 P7 P8 P9 P10 VI 3 2 7 5 4 S 2 3 7 6 3 2 7 5 7 5 2 5 9 6 V3 3 2 7 6 7 5 2 6 9 6 V4 3 5 7 6 7 5 3 6 9 6 VS 3 7 8 6 8 S 9 12 9 8 VG 5 7 11 6 9 5 10 12 9 8 V7 5 7 11 6 9 10 12 8 S cleic clocNNN OOO - 9 In addition, there are selling prices for all variations, which differ from one variation to another as shown in the following table. Table 4. Selling prices of product variations (S/unit) I Product Variation PI P2 P3 P4 P5 P6 P7 P8 P9 P10 vi 71 57 94 103 102 72 50 58 9588 V2 71 56 109 105 115 84 56 101 103 91 V3 63 65 99 108 129 82 55 100 94 99 V4 77 97 113 143 126 75 57 101 98 88 V5 82 106 139 150 159 85 80 117 104 93 V6 102 148 142 150 157 85 106 143 100 94 V7 111 165 150 171 180 86 119 154 110 100 The unit costs for the resources differ from one resource to another, where these costs are estimated to be $4. $7 and $5 for resources 1, 2 and 3, respectively. Also, there is limited availability of the three resources, where 33000 units are available from resource 1, 41000 from resource 2, and 45000 units from resource 3. The company is seeking to determine the monthly product/variation mix that maximizes the profit. After surveying the market and taking into account the existence of other competitors who produce similar products, the company anticipates that its monthly saled of the respective products (from all variations) won't exceed a maximum amount as shown in the following table. Table 5. Maximum sales for each product (units) Product PLP2 P3 P4 P5 P6 P7 P8 P9 P10 Max Sales 450 810 740 660 420 530 380 540 670 790 In addition, there are "blending" constraints, where the percentage of variations 5 to 7 for any product can't exceed a certain percentage from the total amount produced from that product, and also can't be less than a minimum percentage, as shown in the following table. Table 6. Maximum percentages of variations 5 to 7 allowed for each product Product PI P2 P3 P4 PS P6 P7 P8 P9 PIO. Max % 80 60 70 60 40 80 50 80 50 70 Min % 20 15 25 20 10 25 5 15 10 30 You have been hired by the company to assist then in solving the product mix problem at hand. Conduct the necessary analysis and provide the management with a report that provides thorough answers to the following questions. d) Solve the model developed in part (a) using Lingo. Make sure to use the compact form in Lingo e) Using a tabular form, summarize clearly the optimal solution found (i.e. the optimal values for all decision variables), and report the associated optimal objective function value? 1) Is the optimal solution obtained degenerate? Why or why not? g) Is the optimal solution obtained unique? Why or why not Step by Step Solution
There are 3 Steps involved in it
1 Expert Approved Answer
Step: 1 Unlock

Question Has Been Solved by an Expert!
Get step-by-step solutions from verified subject matter experts
Step: 2 Unlock
Step: 3 Unlock