

Question: SOLVE USING EXCEL , SOLVE USING EXCEL !! Question 5 (2 pts) Create 2 grouped bar graphs using the data in the following table: Stock
SOLVE USING EXCEL , 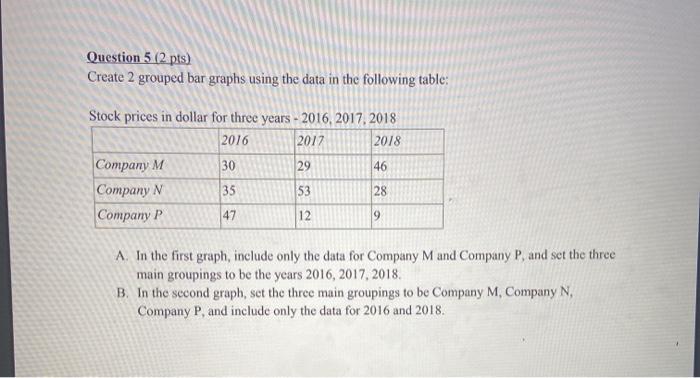
SOLVE USING EXCEL !!
Question 5 (2 pts) Create 2 grouped bar graphs using the data in the following table: Stock prices in dollar for three years - 2016, 2017, 2018 2016 2017 2018 Company M M 30 29 46 Company N 35 53 28 Company P 47 12 9 A. In the first graph, include only the data for Company M and Company P, and set the three main groupings to be the years 2016, 2017, 2018 B. In the second graph, set the three main groupings to be Company M. Company N, Company P, and include only the data for 2016 and 2018
Step by Step Solution
There are 3 Steps involved in it
1 Expert Approved Answer
Step: 1 Unlock

Question Has Been Solved by an Expert!
Get step-by-step solutions from verified subject matter experts
Step: 2 Unlock
Step: 3 Unlock