

Question: Someone else uses a different approach. They calculate a 95% confidence interval for t using the monthly data for 2011 and 2012 in the attached
- Someone else uses a different approach. They calculate a 95% confidence interval for t using the monthly data for 2011 and 2012 in the attached excel spreadsheet.
Calculate the confidence interval for the 2011 - 2012 period. How could you use this to test a null hypothesis that the 2020 -2021 unemployment rate was higher? Be specific. What are you looking for? How can you use a confidence interval to test a hypothesis. What conclusion do you draw and why?
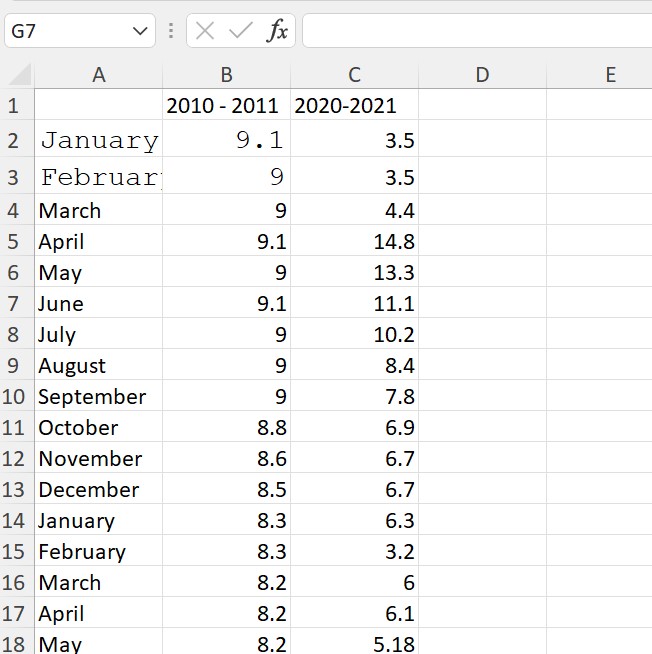
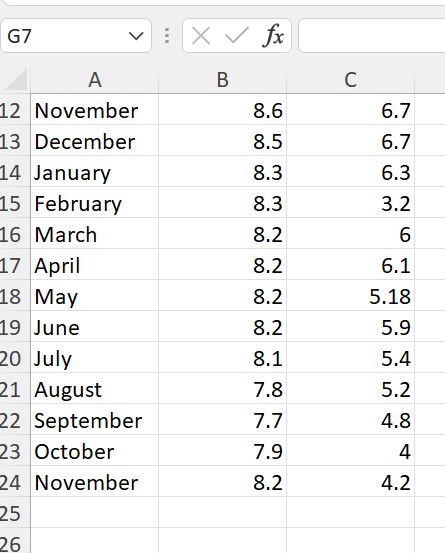
G7 V X V fx A B C D E 2010 - 2011 2020-2021 2 January 9.1 3.5 3 Februar 9 3.5 4 March 9 4.4 5 April 9.1 14.8 6 May 9 13.3 7 June 9.1 11.1 8 July 9 10.2 9 August 9 8.4 10 September 9 7.8 11 October 8.8 6.9 12 November 8.6 6.7 13 December 8.5 6.7 14 January 8.3 6.3 15 February 8.3 3.2 16 March 8.2 6 17 April 8.2 6,1 18 May 8.2 5.18
Step by Step Solution
There are 3 Steps involved in it
1 Expert Approved Answer
Step: 1 Unlock

Question Has Been Solved by an Expert!
Get step-by-step solutions from verified subject matter experts
Step: 2 Unlock
Step: 3 Unlock