

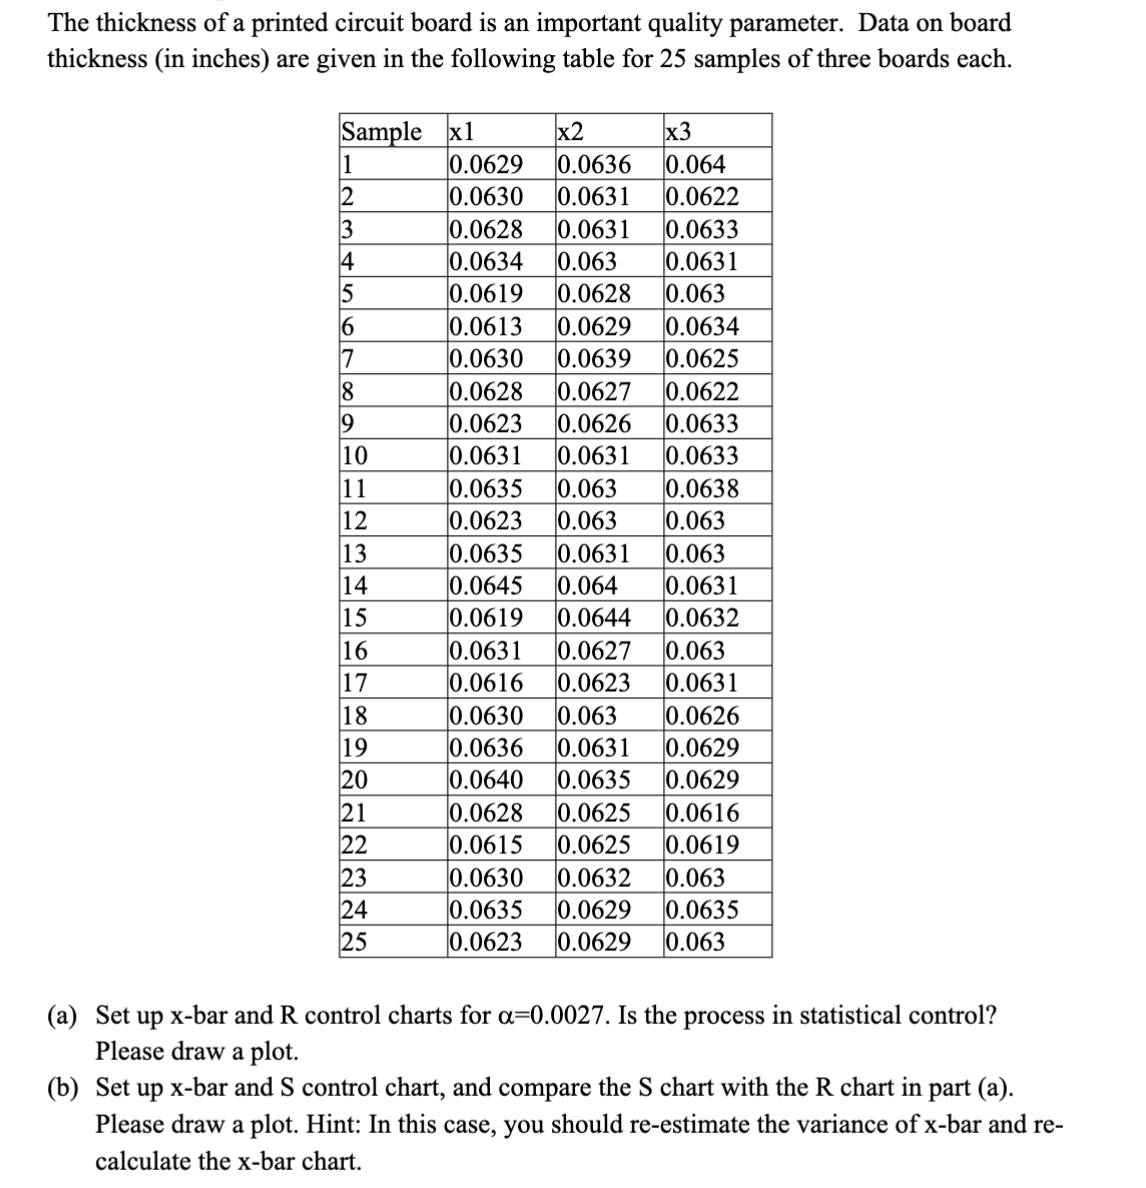
Question: Someone please help, show the graph too when you used excel. I think that' ' s where I got stuck. Thanks The thickness of a
Someone please help, show the graph too when you used excel. I think that's where I got stuck. Thanks The thickness of a printed circuit board is an important quality parameter. Data on board
thickness in inches are given in the following table for samples of three boards each.
a Set up bar and control charts for Is the process in statistical control?
Please draw a plot.
b Set up bar and control chart, and compare the chart with the chart in part a
Please draw a plot. Hint: In this case, you should reestimate the variance of bar and re
calculate the xbar chart.
Step by Step Solution
There are 3 Steps involved in it
1 Expert Approved Answer
Step: 1 Unlock

Question Has Been Solved by an Expert!
Get step-by-step solutions from verified subject matter experts
Step: 2 Unlock
Step: 3 Unlock