

Question: Someone pls create a standard curve and plot points of the absorbance shown . Protein must be Y axis, and absorbance is X axis. In
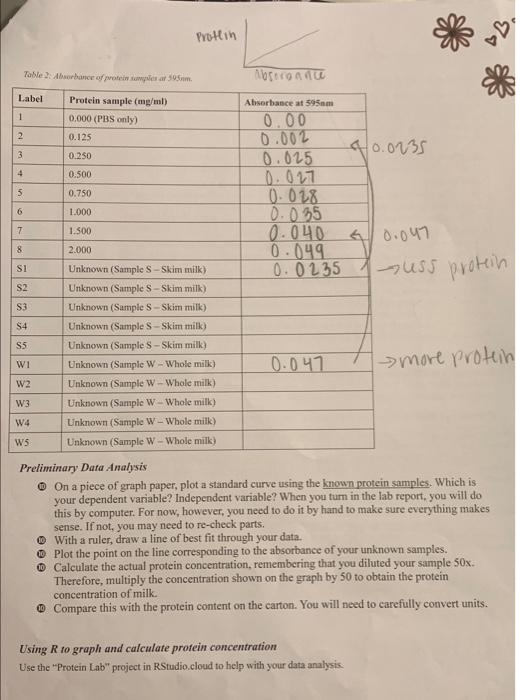
Protein Tables brance of protein suples ar 50m. Abrononnu Label Absorbance 595mm 1 Protein sample (mg/ml) 0.000 (PBS only) 0.125 2 3 3 0.250 4 0.500 5 0.750 0.00 0.002 0.025 40.0035 0.027 0.028 0.0.35 10.040 40.047 0.049 0.0235 Iuss protein 6 7 8 S1 S2 S3 S4 1.000 1.500 2.000 Unknown (Sample S -Skim milk) Unknown (Sample S -Skim milk) Unknown (Sample S -Skim milk) Unknown (Sample S -Skim milk) Unknown (Sample S-Skim milk) Unknown (Sample W - Whole milk) Unknown (Sample W - Whole milk) Unknown (Sample W-Whole milk) Unknown (Sample W - Whole milk) Unknown (Sample W-Whole milk) S5 wi 0.047 1 more protein W2 W3 W4 ws Preliminary Data Analysis On a piece of graph paper, plot a standard curve using the known protein samples. Which is your dependent variable? Independent variable? When you turn in the lab report, you will do this by computer. For now, however, you need to do it by hand to make sure everything makes sense. If not, you may need to re-check parts. With a ruler, draw a line of best fit through your data. Plot the point on the line corresponding to the absorbance of your unknown samples. O Calculate the actual protein concentration, remembering that you diluted your sample 50x. Therefore, multiply the concentration shown on the graph by 50 to obtain the protein concentration of milk. Compare this with the protein content on the carton. You will need to carefully convert units. Using R to graph and calculate protein concentration Use the "Protein Lab" project in RStudio.cloud to help with your data analysis Protein Tables brance of protein suples ar 50m. Abrononnu Label Absorbance 595mm 1 Protein sample (mg/ml) 0.000 (PBS only) 0.125 2 3 3 0.250 4 0.500 5 0.750 0.00 0.002 0.025 40.0035 0.027 0.028 0.0.35 10.040 40.047 0.049 0.0235 Iuss protein 6 7 8 S1 S2 S3 S4 1.000 1.500 2.000 Unknown (Sample S -Skim milk) Unknown (Sample S -Skim milk) Unknown (Sample S -Skim milk) Unknown (Sample S -Skim milk) Unknown (Sample S-Skim milk) Unknown (Sample W - Whole milk) Unknown (Sample W - Whole milk) Unknown (Sample W-Whole milk) Unknown (Sample W - Whole milk) Unknown (Sample W-Whole milk) S5 wi 0.047 1 more protein W2 W3 W4 ws Preliminary Data Analysis On a piece of graph paper, plot a standard curve using the known protein samples. Which is your dependent variable? Independent variable? When you turn in the lab report, you will do this by computer. For now, however, you need to do it by hand to make sure everything makes sense. If not, you may need to re-check parts. With a ruler, draw a line of best fit through your data. Plot the point on the line corresponding to the absorbance of your unknown samples. O Calculate the actual protein concentration, remembering that you diluted your sample 50x. Therefore, multiply the concentration shown on the graph by 50 to obtain the protein concentration of milk. Compare this with the protein content on the carton. You will need to carefully convert units. Using R to graph and calculate protein concentration Use the "Protein Lab" project in RStudio.cloud to help with your data analysis
Step by Step Solution
There are 3 Steps involved in it

Get step-by-step solutions from verified subject matter experts