

Question: soring operations Activity: p - Chart for Quality Control Conceptual Overview: Exploring how p - charts are used to detect processes out of control. sense
soring operations Activity: pChart for Quality Control
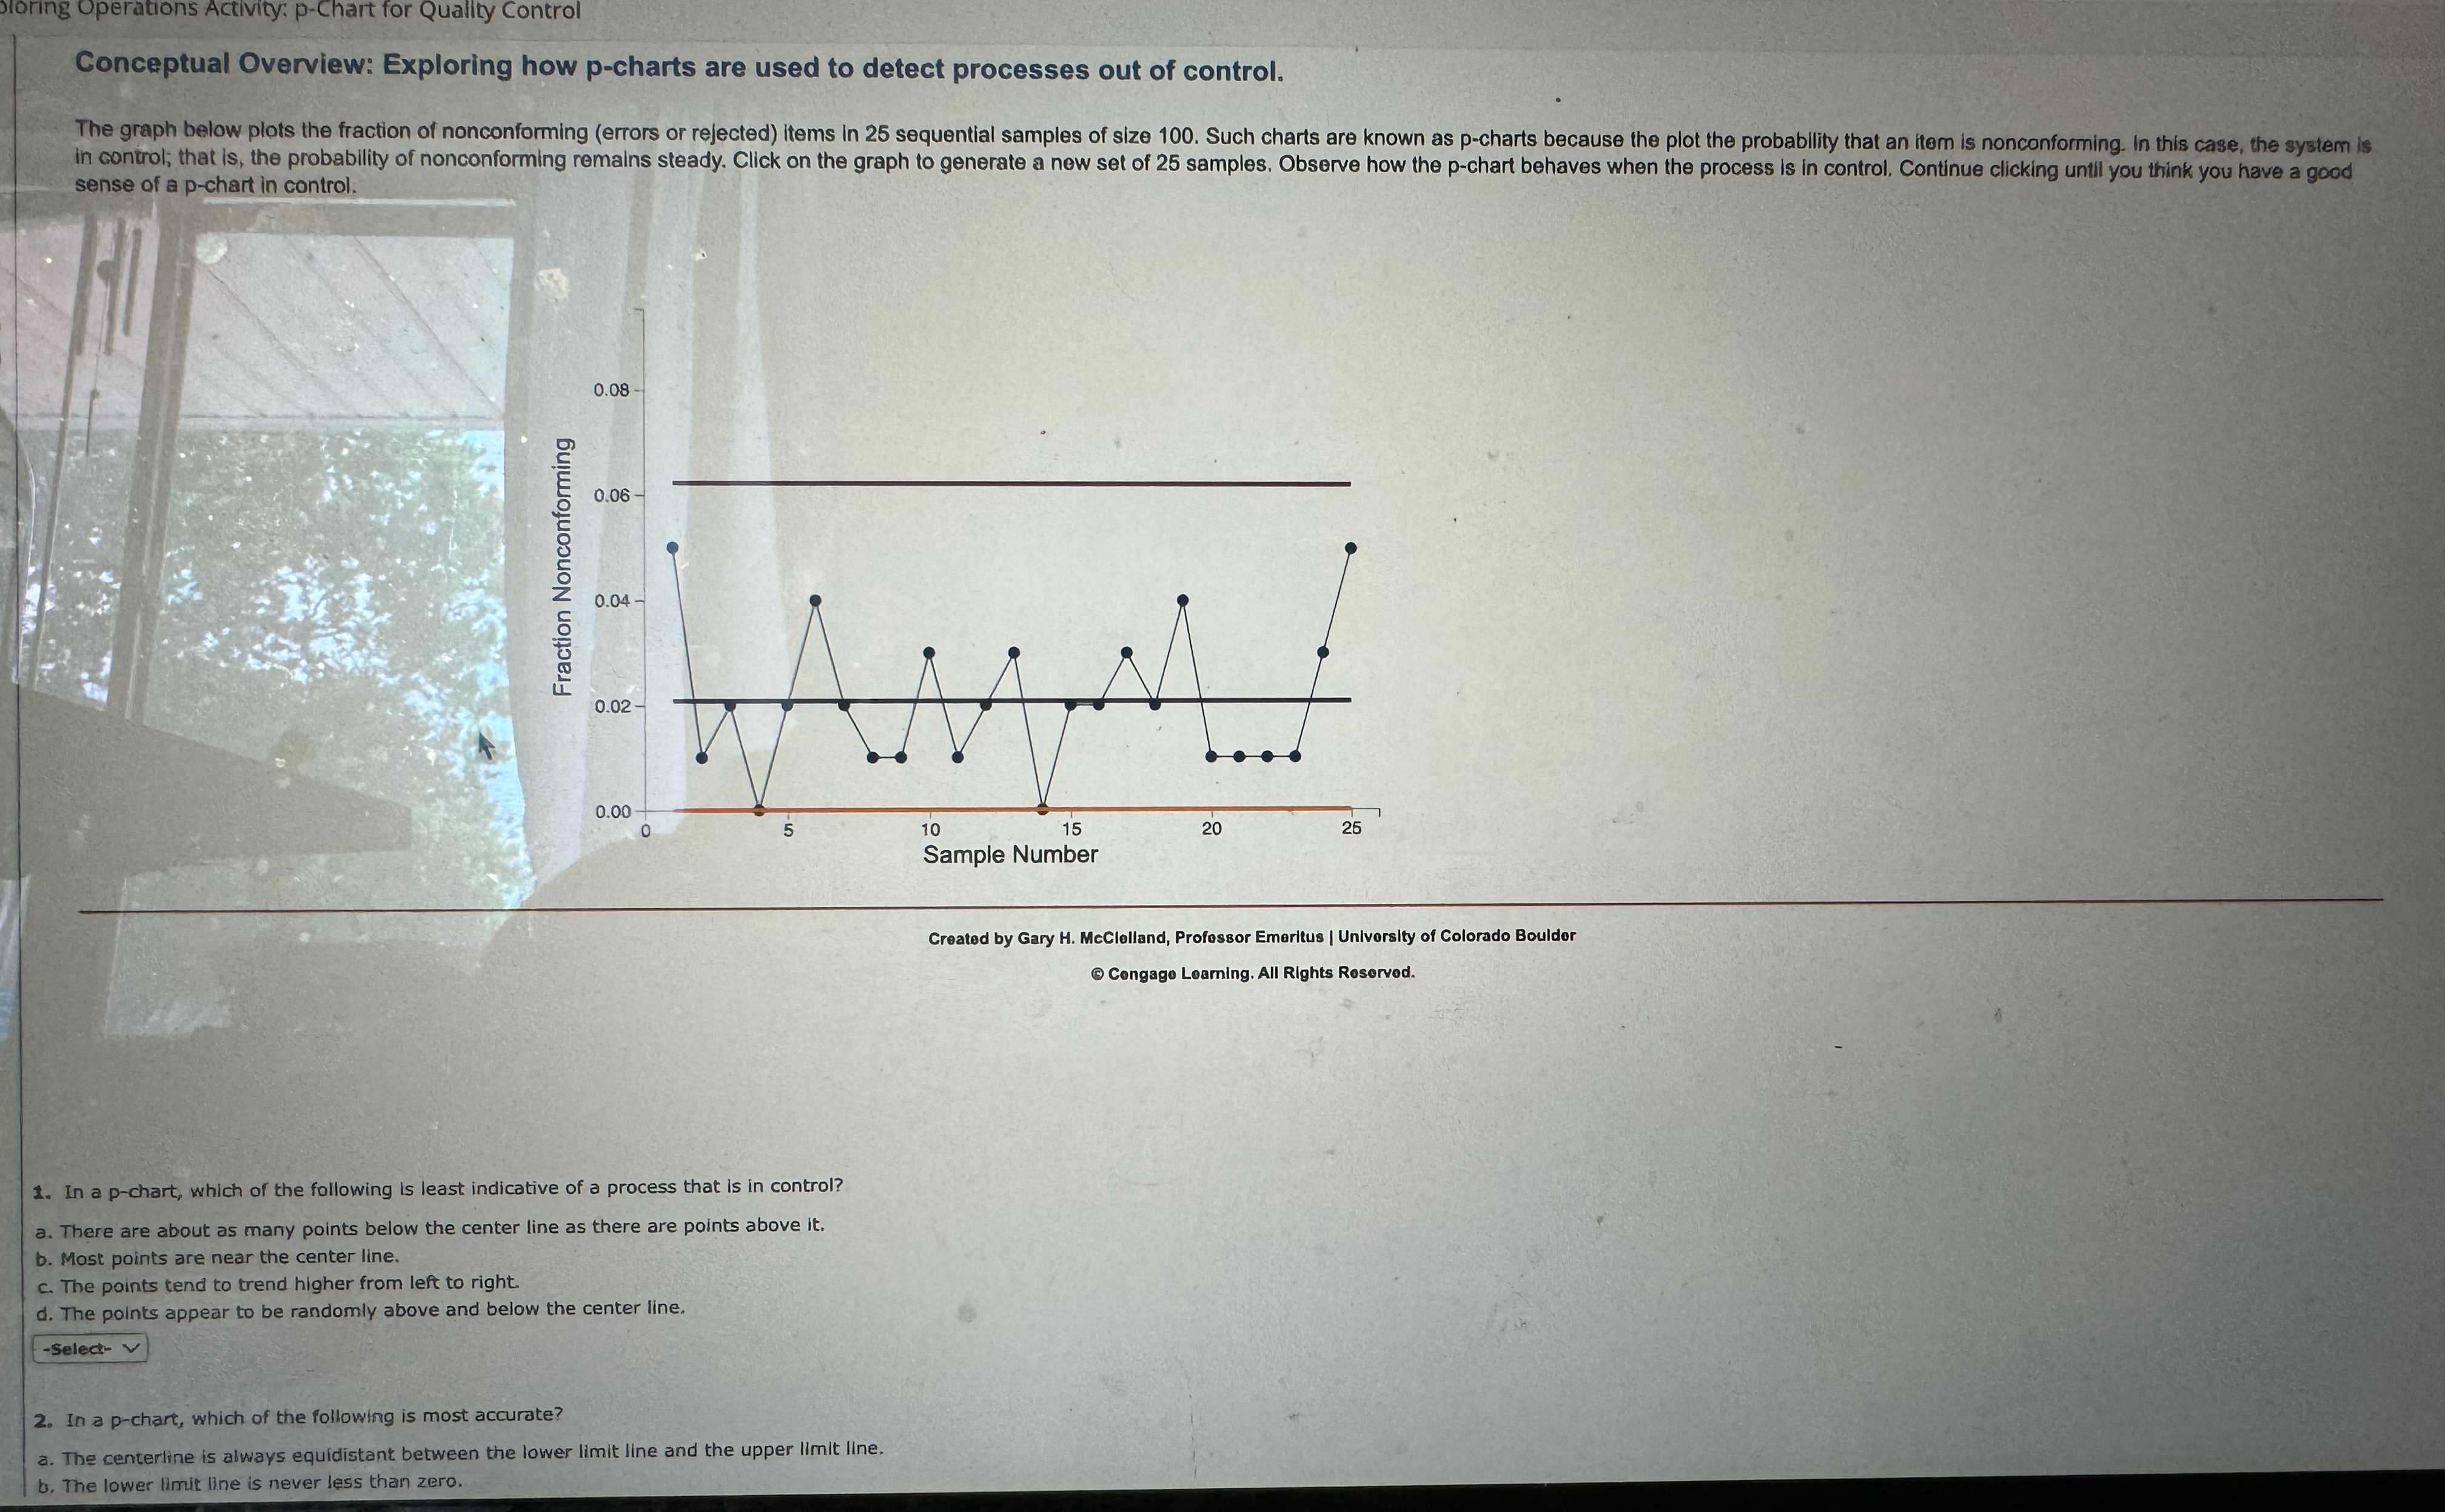
Conceptual Overview: Exploring how pcharts are used to detect processes out of control. sense of a pchart in control.
Created by Gary H McClelland, Professor Emerleus University of Colorado Boulder
Congago Leaming. All Rights Rosorvod.
In a pchart, which of the following is least indicative of a process that is in control?
a There are about as many points below the center line as there are points above it
b Most points are near the center line.
c The points tend to trend higher from left to right.
d The points appear to be randomly above and below the center line.
In a pchart, which of the following is most accurate?
a The centerline is always equidistant between the lower limit line and the upper limit line.
b The lower limit line is never less than zero.
Step by Step Solution
There are 3 Steps involved in it
1 Expert Approved Answer
Step: 1 Unlock

Question Has Been Solved by an Expert!
Get step-by-step solutions from verified subject matter experts
Step: 2 Unlock
Step: 3 Unlock