

Question: Sorry, this is so long. I need to solve the yellow areas and I am a little unsure of the equations required to calculate these
Sorry, this is so long. I need to solve the yellow areas and I am a little unsure of the equations required to calculate these values. The ones I have calculated make sense and even some down the list, but I want to ensure I solve them correctly in order. I appreciate a simple to understand breakdown and your time!
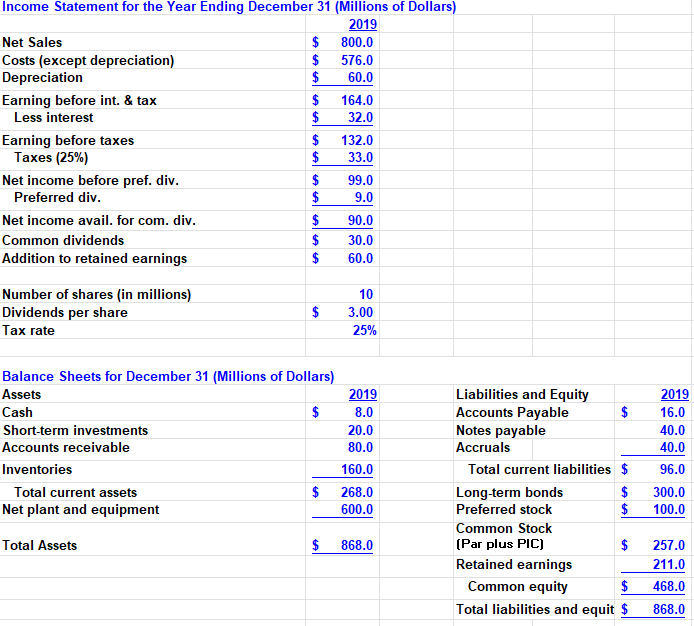
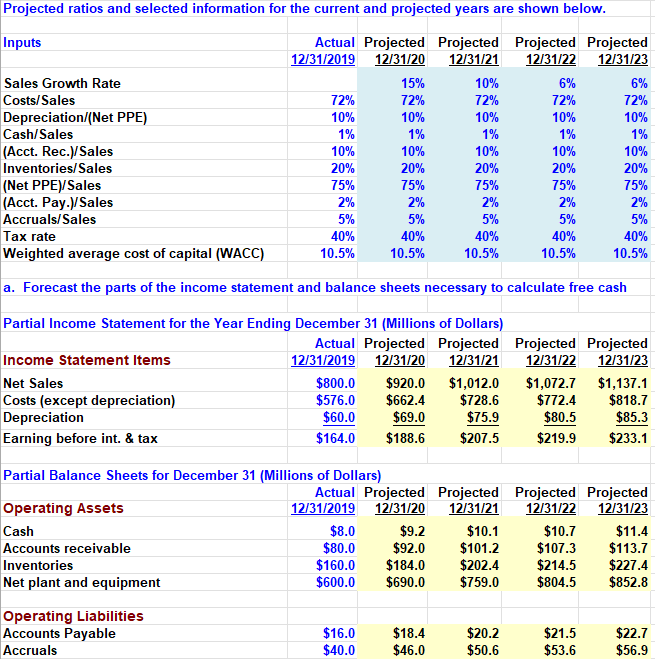
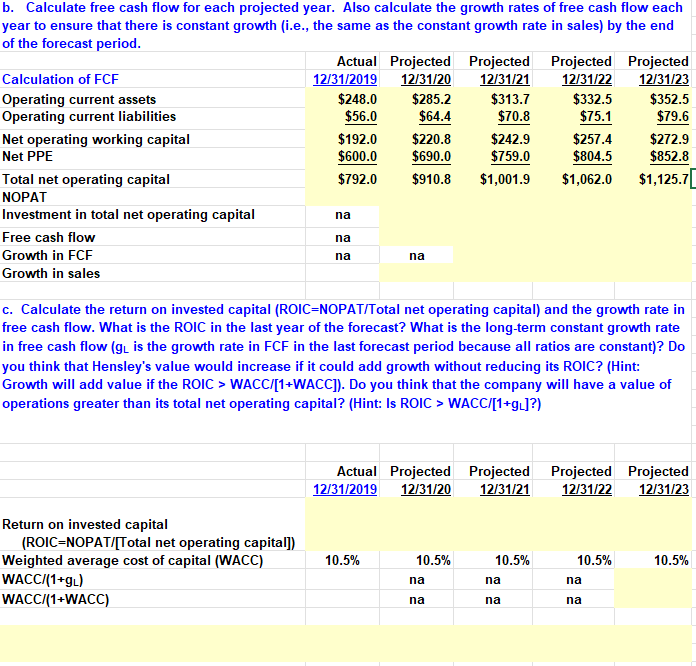
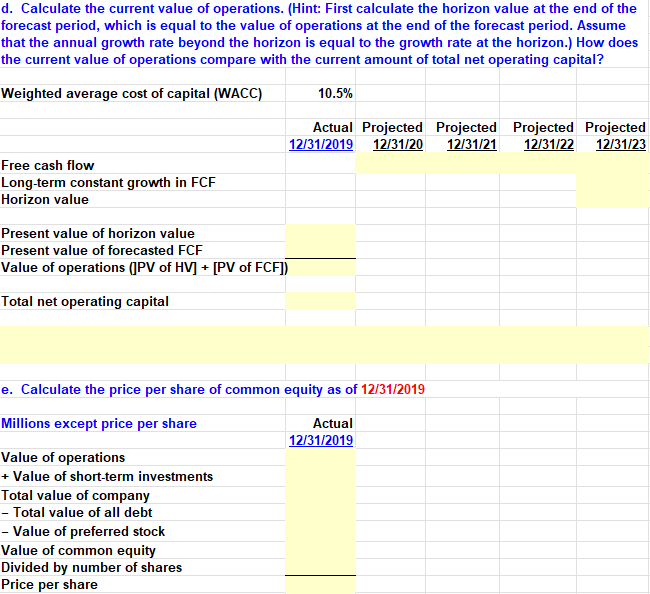
Income Statement for the Year Ending December 31 (Millions of Dollars) 2019 Net Sales $ 800.0 Costs (except depreciation) $ 576.0 Depreciation $ 60.0 Earning before int. & tax $ 164.0 Less interest $ 32.0 Earning before taxes $ 132.0 Taxes (25%) $ 33.0 Net income before pref. div. $ 99.0 Preferred div. $ 9.0 Net income avail. for com. div. $ 90.0 Common dividends $ 30.0 Addition to retained earnings $ 60.0 AA Number of shares (in millions) Dividends per share Tax rate $ 10 3.00 25% Balance Sheets for December 31 (Millions of Dollars) Assets 2019 Cash $ 8.0 Short-term investments 20.0 Accounts receivable 80.0 Inventories 160.0 Total current assets $ 268.0 Net plant and equipment 600.0 Liabilities and Equity Accounts Payable $ Notes payable Accruals Total current liabilities $ Long-term bonds $ Preferred stock $ Common Stock (Par plus PIC) $ Retained earnings Common equity $ Total liabilities and equit $ 2019 16.0 40.0 40.0 96.0 300.0 100.0 Total Assets $ 868.0 257.0 211.0 468.0 868.0 Projected ratios and selected information for the current and projected years are shown below. Inputs Sales Growth Rate Costs/Sales Depreciation/(Net PPE) Cash/Sales (Acct. Rec.)/Sales Inventories/Sales (Net PPE)/Sales (Acct. Pay.)/Sales Accruals/Sales Tax rate Weighted average cost of capital (WACC) Actual Projected Projected Projected Projected 12/31/2019 12/31/20 12/31/21 12/31/22 12/31/23 15% 10% 6% 6% 72% 72% 72% 72% 72% 10% 10% 10% 10% 10% 1% 1% 1% 1% 1% 10% 10% 10% 10% 10% 20% 20% 20% 20% 20% 75% 75% 75% 75% 75% 2% 2% 2% 2% 2% 5% 5% 5% 5% 5% 40% 40% 40% 40% 40% 10.5% 10.5% 10.5% 10.5% 10.5% a. Forecast the parts of the income statement and balance sheets necessary to calculate free cash Partial Income Statement for the Year Ending December 31 (Millions of Dollars) Actual Projected Projected Projected Projected Income Statement Items 12/31/2019 12/31/20 12/31/21 12/31/22 12/31/23 Net Sales $800.0 $920.0 $1,012.0 $1,072.7 $1,137.1 Costs (except depreciation) $576.0 $662.4 $728.6 $772.4 $818.7 Depreciation $60.0 $69.0 $75.9 $80.5 $85.3 Earning before int. & tax $164.0 $188.6 $207.5 $219.9 $233.1 Partial Balance Sheets for December 31 (Millions of Dollars) Actual Projected Projected Projected Projected Operating Assets 12/31/2019 12/31/20 12/31/21 12/31/22 12/31/23 Cash $8.0 $9.2 $10.1 $10.7 $11.4 Accounts receivable $80.0 $92.0 $101.2 $107.3 $113.7 Inventories $160.0 $184.0 $202.4 $214.5 $227.4 Net plant and equipment $600.0 $690.0 $759.0 $804.5 $852.8 Operating Liabilities Accounts Payable Accruals $16.0 $40.0 $18.4 $46.0 $20.2 $50.6 $21.5 $53.6 $22.7 $56.9 b. Calculate free cash flow for each projected year. Also calculate the growth rates of free cash flow each year to ensure that there is constant growth (i.e., the same as the constant growth rate in sales) by the end of the forecast period. Actual Projected Projected Projected Projected Calculation of FCF 12/31/2019 12/31/20 12/31/21 12/31/22 12/31/23 Operating current assets $248.0 $285.2 $313.7 $332.5 $352.5 Operating current liabilities $56.0 $64.4 $70.8 $75.1 $79.6 Net operating working capital $192.0 $220.8 $242.9 $257.4 $272.9 Net PPE $600.0 $690.0 $759.0 $804.5 $852.8 Total net operating capital $792.0 $910.8 $1,001.9 $1,062.0 $1,125.7 NOPAT Investment in total net operating capital Free cash flow Growth in FCF Growth in sales na na na na c. Calculate the return on invested capital (ROIC=NOPAT/Total net operating capital) and the growth rate in free cash flow. What is the ROIC in the last year of the forecast? What is the long-term constant growth rate in free cash flow (gl is the growth rate in FCF in the last forecast period because all ratios are constant)? Do you think that Hensley's value would increase if it could add growth without reducing its ROIC? (Hint: Growth will add value if the ROIC > WACC/[1+WACC)). Do you think that the company will have a value of operations greater than its total net operating capital? (Hint: Is ROIC > WACCI[1+g.]?) : Actual Projected Projected Projected Projected 12/31/2019 12/31/20 12/31/21 12/31/22 12/31/23 Return on invested capital (ROIC=NOPAT/[Total net operating capital]) Weighted average cost of capital (WACC) WACC/(1+92) WACCI(1+WACC) 10.5% 10.5% 10.5% 10.5% na 10.5% na na na na na d. Calculate the current value of operations. (Hint: First calculate the horizon value at the end of the forecast period, which is equal to the value of operations at the end of the forecast period. Assume that the annual growth rate beyond the horizon is equal to the growth rate at the horizon.) How does the current value of operations compare with the current amount of total net operating capital? Weighted average cost of capital (WACC) 10.5% Actual Projected Projected Projected Projected 12/31/2019 12/31/20 12/31/21 12/31/22 12/31/23 Free cash flow Long-term constant growth in FCF Horizon value Present value of horizon value Present value of forecasted FCF Value of operations (JPV of HV] + [PV of FCF]) Total net operating capital e. Calculate the price per share of common equity as of 12/31/2019 Actual 12/31/2019 Millions except price per share Value of operations + Value of short-term investments Total value of company - Total value of all debt - Value of preferred stock Value of common equity Divided by number of shares Price per share Income Statement for the Year Ending December 31 (Millions of Dollars) 2019 Net Sales $ 800.0 Costs (except depreciation) $ 576.0 Depreciation $ 60.0 Earning before int. & tax $ 164.0 Less interest $ 32.0 Earning before taxes $ 132.0 Taxes (25%) $ 33.0 Net income before pref. div. $ 99.0 Preferred div. $ 9.0 Net income avail. for com. div. $ 90.0 Common dividends $ 30.0 Addition to retained earnings $ 60.0 AA Number of shares (in millions) Dividends per share Tax rate $ 10 3.00 25% Balance Sheets for December 31 (Millions of Dollars) Assets 2019 Cash $ 8.0 Short-term investments 20.0 Accounts receivable 80.0 Inventories 160.0 Total current assets $ 268.0 Net plant and equipment 600.0 Liabilities and Equity Accounts Payable $ Notes payable Accruals Total current liabilities $ Long-term bonds $ Preferred stock $ Common Stock (Par plus PIC) $ Retained earnings Common equity $ Total liabilities and equit $ 2019 16.0 40.0 40.0 96.0 300.0 100.0 Total Assets $ 868.0 257.0 211.0 468.0 868.0 Projected ratios and selected information for the current and projected years are shown below. Inputs Sales Growth Rate Costs/Sales Depreciation/(Net PPE) Cash/Sales (Acct. Rec.)/Sales Inventories/Sales (Net PPE)/Sales (Acct. Pay.)/Sales Accruals/Sales Tax rate Weighted average cost of capital (WACC) Actual Projected Projected Projected Projected 12/31/2019 12/31/20 12/31/21 12/31/22 12/31/23 15% 10% 6% 6% 72% 72% 72% 72% 72% 10% 10% 10% 10% 10% 1% 1% 1% 1% 1% 10% 10% 10% 10% 10% 20% 20% 20% 20% 20% 75% 75% 75% 75% 75% 2% 2% 2% 2% 2% 5% 5% 5% 5% 5% 40% 40% 40% 40% 40% 10.5% 10.5% 10.5% 10.5% 10.5% a. Forecast the parts of the income statement and balance sheets necessary to calculate free cash Partial Income Statement for the Year Ending December 31 (Millions of Dollars) Actual Projected Projected Projected Projected Income Statement Items 12/31/2019 12/31/20 12/31/21 12/31/22 12/31/23 Net Sales $800.0 $920.0 $1,012.0 $1,072.7 $1,137.1 Costs (except depreciation) $576.0 $662.4 $728.6 $772.4 $818.7 Depreciation $60.0 $69.0 $75.9 $80.5 $85.3 Earning before int. & tax $164.0 $188.6 $207.5 $219.9 $233.1 Partial Balance Sheets for December 31 (Millions of Dollars) Actual Projected Projected Projected Projected Operating Assets 12/31/2019 12/31/20 12/31/21 12/31/22 12/31/23 Cash $8.0 $9.2 $10.1 $10.7 $11.4 Accounts receivable $80.0 $92.0 $101.2 $107.3 $113.7 Inventories $160.0 $184.0 $202.4 $214.5 $227.4 Net plant and equipment $600.0 $690.0 $759.0 $804.5 $852.8 Operating Liabilities Accounts Payable Accruals $16.0 $40.0 $18.4 $46.0 $20.2 $50.6 $21.5 $53.6 $22.7 $56.9 b. Calculate free cash flow for each projected year. Also calculate the growth rates of free cash flow each year to ensure that there is constant growth (i.e., the same as the constant growth rate in sales) by the end of the forecast period. Actual Projected Projected Projected Projected Calculation of FCF 12/31/2019 12/31/20 12/31/21 12/31/22 12/31/23 Operating current assets $248.0 $285.2 $313.7 $332.5 $352.5 Operating current liabilities $56.0 $64.4 $70.8 $75.1 $79.6 Net operating working capital $192.0 $220.8 $242.9 $257.4 $272.9 Net PPE $600.0 $690.0 $759.0 $804.5 $852.8 Total net operating capital $792.0 $910.8 $1,001.9 $1,062.0 $1,125.7 NOPAT Investment in total net operating capital Free cash flow Growth in FCF Growth in sales na na na na c. Calculate the return on invested capital (ROIC=NOPAT/Total net operating capital) and the growth rate in free cash flow. What is the ROIC in the last year of the forecast? What is the long-term constant growth rate in free cash flow (gl is the growth rate in FCF in the last forecast period because all ratios are constant)? Do you think that Hensley's value would increase if it could add growth without reducing its ROIC? (Hint: Growth will add value if the ROIC > WACC/[1+WACC)). Do you think that the company will have a value of operations greater than its total net operating capital? (Hint: Is ROIC > WACCI[1+g.]?) : Actual Projected Projected Projected Projected 12/31/2019 12/31/20 12/31/21 12/31/22 12/31/23 Return on invested capital (ROIC=NOPAT/[Total net operating capital]) Weighted average cost of capital (WACC) WACC/(1+92) WACCI(1+WACC) 10.5% 10.5% 10.5% 10.5% na 10.5% na na na na na d. Calculate the current value of operations. (Hint: First calculate the horizon value at the end of the forecast period, which is equal to the value of operations at the end of the forecast period. Assume that the annual growth rate beyond the horizon is equal to the growth rate at the horizon.) How does the current value of operations compare with the current amount of total net operating capital? Weighted average cost of capital (WACC) 10.5% Actual Projected Projected Projected Projected 12/31/2019 12/31/20 12/31/21 12/31/22 12/31/23 Free cash flow Long-term constant growth in FCF Horizon value Present value of horizon value Present value of forecasted FCF Value of operations (JPV of HV] + [PV of FCF]) Total net operating capital e. Calculate the price per share of common equity as of 12/31/2019 Actual 12/31/2019 Millions except price per share Value of operations + Value of short-term investments Total value of company - Total value of all debt - Value of preferred stock Value of common equity Divided by number of shares Price per share
Step by Step Solution
There are 3 Steps involved in it

Get step-by-step solutions from verified subject matter experts