

Question: source: https://www.realtor.com/research/data/ Purpose: What was the purpose of your analysis, and what is your approach? Define a random sample and two hypotheses (means) to analyze.
source: https://www.realtor.com/research/data/
- Purpose:What was the purpose of your analysis, and what is your approach?
- Define a random sample and two hypotheses (means) to analyze.
- Sample:Define your sample. Take a random sample of 100 observations for your region.
- Describe what is included in your sample (i.e., states, region, years or months).
- Questions and type of test:For your selected sample, define two hypothesis questions and the appropriate type of test hypothesis for each. Address the followingfor each hypothesis:
- Describe the population parameter for the variable you are analyzing.
- Describe your hypothesis in your own words.
- Describe the inference test you will use.
- Identify the test statistic.
- Level of confidence:Discuss how you will use estimation and conference intervals to help you solve the problem.
1-Tail Test
- Hypothesis:Define your hypothesis.
- Define the population parameter.
- Write null (Ho) and alternative (Ha) hypotheses.
- Specify your significance level.
- Data analysis:Analyze the data and confirm assumptions have not been violated to complete this hypothesis test.
- Summarize your sample data using appropriate graphical displays and summary statistics.
- Provide at least one histogram of your sample data.
- In a table, provide summary statistics including sample size, mean, median, and standard deviation.
- Summarize your sample data, describing the center, spread, and shape in comparison to the national information.
- Check the conditions.
- Determine if the normal condition has been met.
- Determine if there are any other conditions that you should check and whether they have been met.
- Hypothesis test calculations:Complete hypothesis test calculations, providing the appropriate statistics and graphs.
- Calculate the hypothesis statistics.
- Determine the appropriate test statistic (t).
- Calculate the probability (pvalue).
- Interpretation:Interpret your hypothesis test results using the p value method to reject or not reject the null hypothesis.
- Relate thepvalue and significance level.
- Make the correct decision (reject or fail to reject).
- Provide a conclusion in the context of your hypothesis.
2-Tail Test
- Hypotheses:Define your hypothesis.
- Define the population parameter.
- Write null and alternative hypotheses.
- State your significance level.
- Data analysis:Analyze the data and confirm assumptions have not been violated to complete this hypothesis test.
- Summarize your sample data using appropriate graphical displays and summary statistics.
- Provide at least one histogram of your sample data.
- In a table, provide summary statistics including sample size, mean, median, and standard deviation.
- Summarize your sample data, describing the center, spread, and shape in comparison to the national information.
- Check the assumptions.
- Determine if the normal condition has been met.
- Determine if there are any other conditions that should be checked on and whether they have been met.
- Hypothesis test calculations:Complete hypothesis test calculations, providing the appropriate statistics and graphs.
- Calculate the hypothesis statistics.
- Determine the appropriate test statistic (t).
- Determine the probability (pvalue).
- Interpretation:Interpret your hypothesis test results using thepvalue method to reject or not reject the null hypothesis.
- Relate thepvalue and significance level.
- Make the correct decision (reject or fail to reject).
- Provide a conclusion in the context of your hypothesis.
- Comparison of the test results:See Question 3 from the Scenario section.
- Calculate a 95% confidence interval. Show or describe your method of calculation.
- Interpret a 95% confidence interval.
Final Conclusions
- Summarize your findings:Refer back to the Introduction section above and summarize your findings of the sample you selected.
- Discuss:Discuss whether you were surprised by the findings. Why or why not?
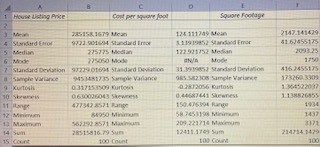
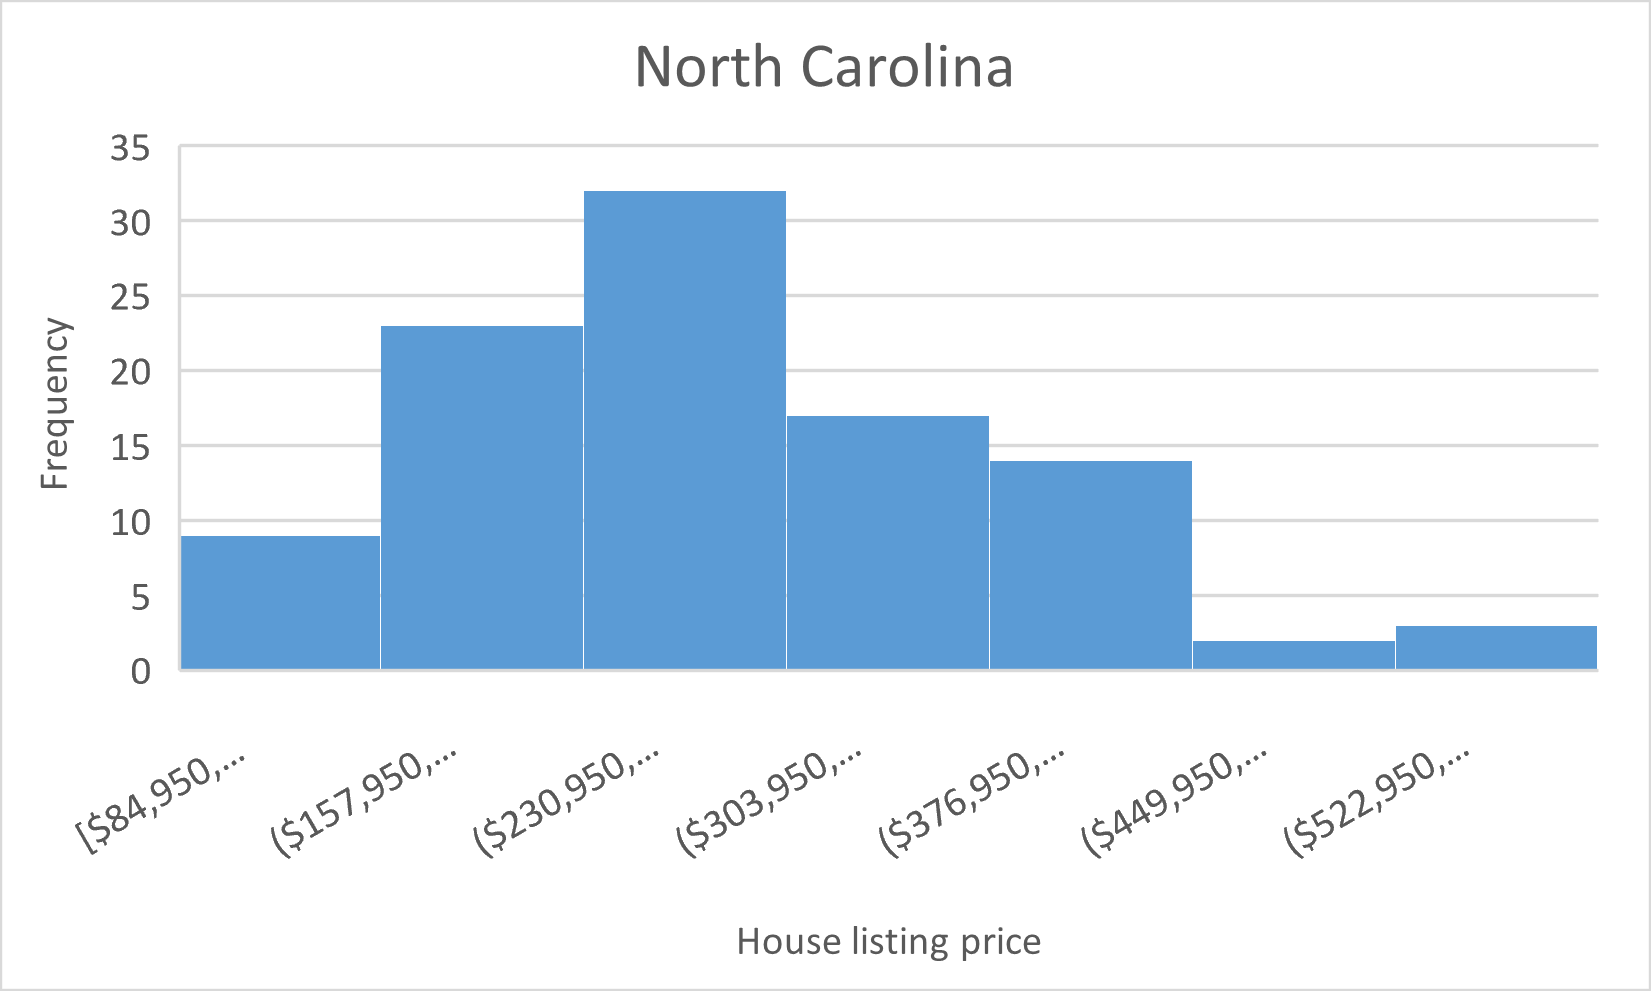
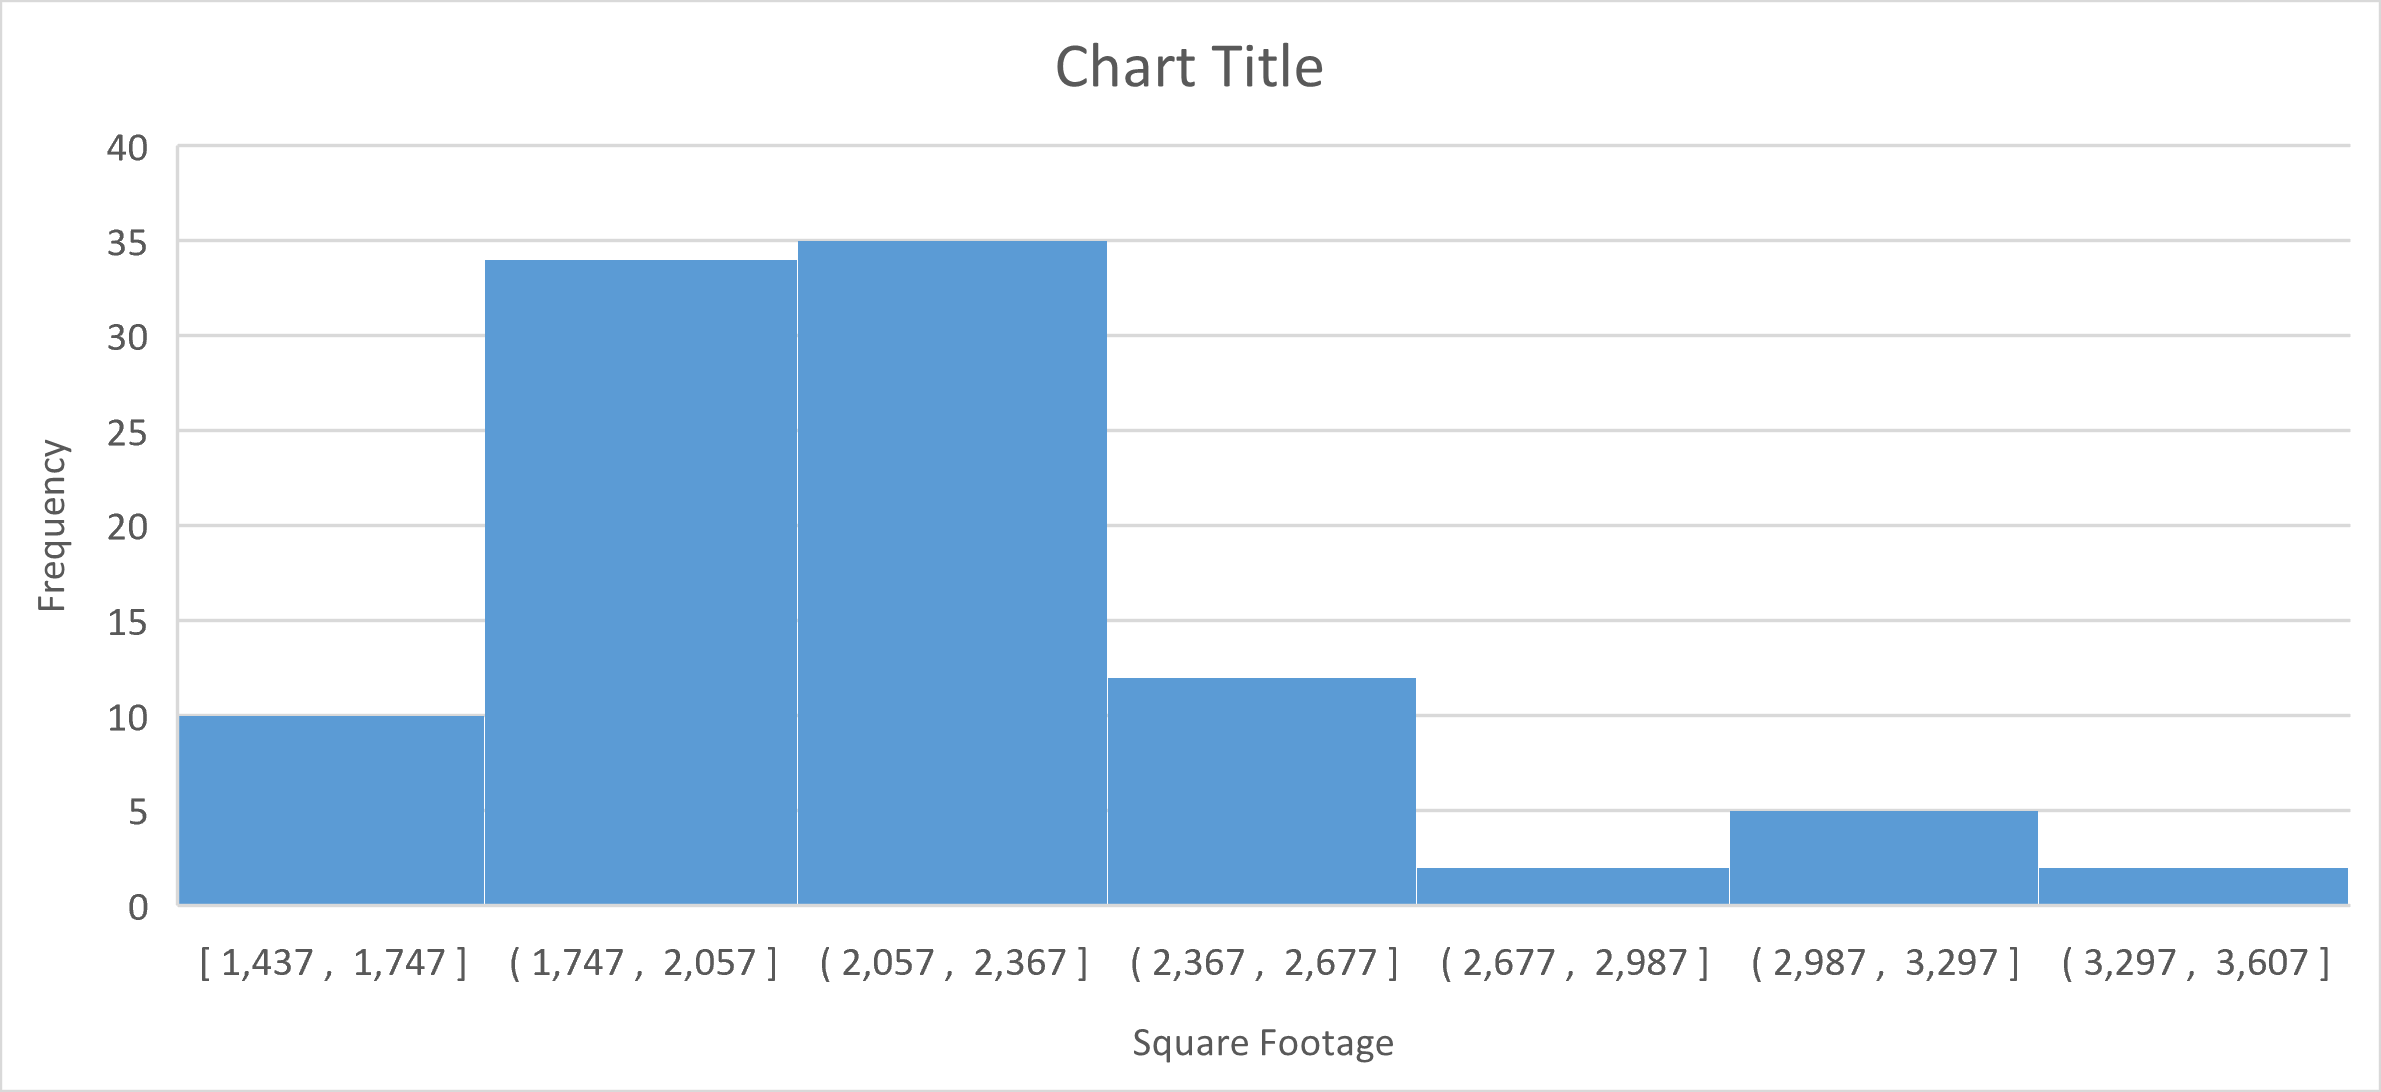
416 3455175 ATP 13410.14Sum 100.CountNorth Carolina 35 30 25 20 Frequency 15 10 5 O [$84,950,... ($157,950,... ($230, 950,... ($303,950,... ($376,950,... ($449,950,... ($522,950,... House listing priceChart Title 40 35 30 25 Frequency 20 15 10 5 0 [ 1,437 , 1,747 ] ( 1,747 , 2,057 ] ( 2,057 , 2,367 ] ( 2,367 , 2,677 ] ( 2,677 , 2,987 ] (2,987 , 3,297 ] (3,297, 3,607 ] Square Footage
Step by Step Solution
There are 3 Steps involved in it
1 Expert Approved Answer
Step: 1 Unlock

Question Has Been Solved by an Expert!
Get step-by-step solutions from verified subject matter experts
Step: 2 Unlock
Step: 3 Unlock