

Question: Source: Statistics Canada - Small business profiles, Quartiles: Whole industry (reliability) begin{tabular}{l} begin{tabular}{l} Bottom quartile (25%) end{tabular} hline end{tabular} 4485 Number of
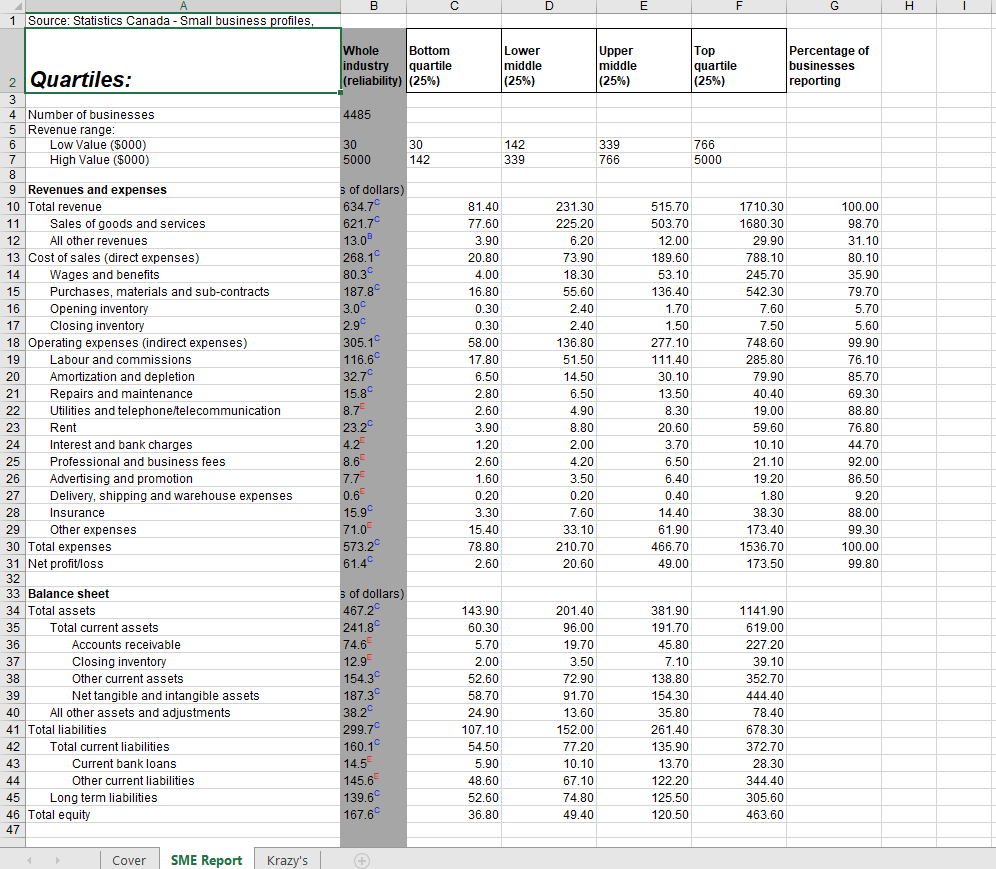
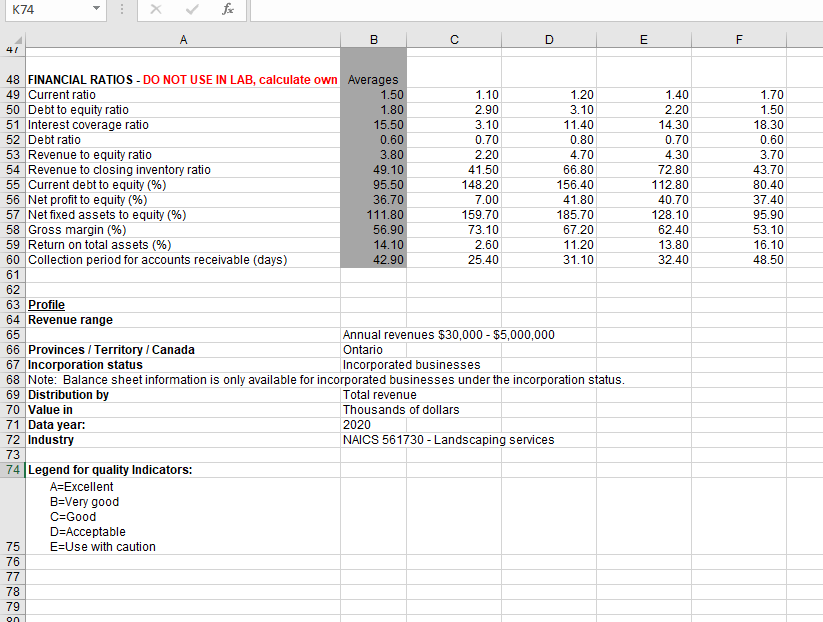
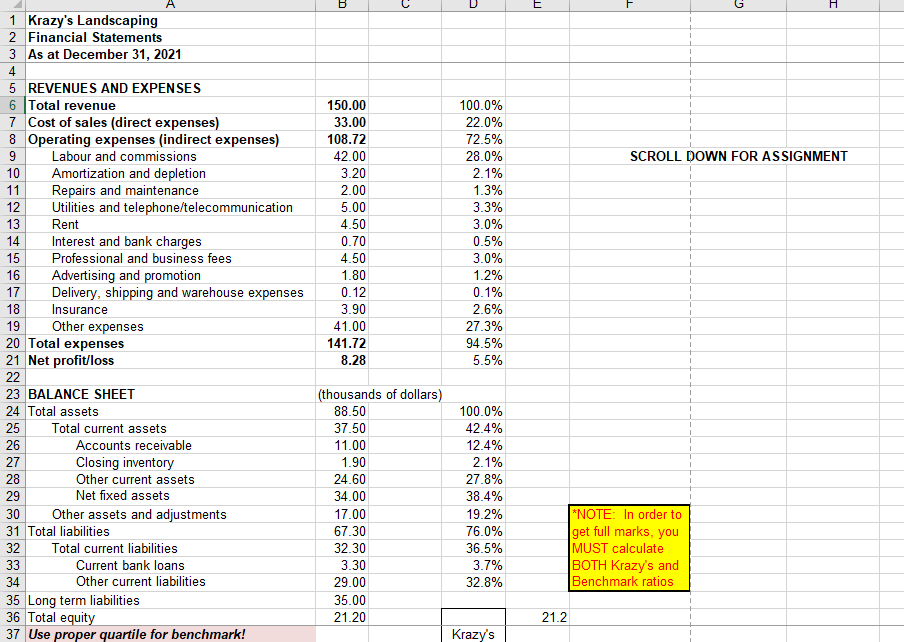
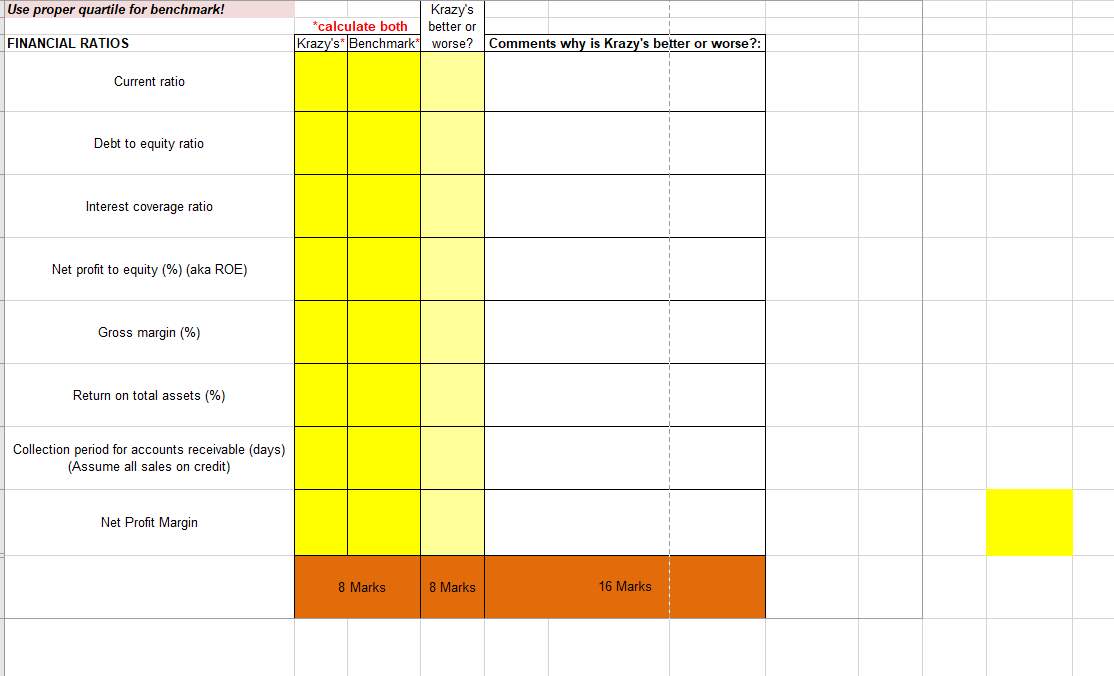
Source: Statistics Canada - Small business profiles, Quartiles: Whole industry (reliability) \begin{tabular}{l} \begin{tabular}{l} Bottom \\ quartile \\ (25%) \end{tabular} \\ \hline \end{tabular} 4485 Number of businesses Revenue range: Low Value ($000) High Value ($000) 30 5000 Revenues and expenses Total revenue Sales of goods and services All other revenues Cost of sales (direct expenses) Wages and benefits Purchases, materials and sub-contracts Opening inventory Closing inventory Operating expenses (indirect expenses) Labour and commissions Amortization and depletion Repairs and maintenance Utilities and telephone/telecommunication Rent Interest and bank charges Professional and business fees Advertising and promotion Delivery, shipping and warehouse expenses Insurance Other expenses Total expenses Net profit/loss 5 of dollars) 634.7c 621.7C 13.0B 268.1C 80.3C 187.8C 3. 0C 2.9C 305.1 116.6C 32.7C 15.8C 8.7 23.2c 4.2 8.6 7.75 0.6 15.9C 71.0 573.2C 61.4C 30 142 \begin{tabular}{|l|} 142 \\ 339 \end{tabular} \begin{tabular}{|l|l|} \hline 339 & 766 \\ \hline 766 & 5000 \end{tabular} \begin{tabular}{|l|l|} \begin{tabular}{l} Lower \\ middle \\ (25%) \end{tabular} & \begin{tabular}{l} Upper \\ middle \\ (25%) \end{tabular} \\ \hline \end{tabular} \begin{tabular}{|l|l} \hline \begin{tabular}{l} Top \\ quartile \\ (25%) \end{tabular} & \begin{tabular}{l} Percentage of \\ businesses \\ reporting \end{tabular} \\ \hline \end{tabular} ) \begin{tabular}{|c|c|c|c|c|} \hline & & & & \\ \hline 81.40 & 231.30 & 515.70 & 1710.30 & 100.00 \\ \hline 77.60 & 225.20 & 503.70 & 1680.30 & 98.70 \\ \hline 3.90 & 6.20 & 12.00 & 29.90 & 31.10 \\ \hline 20.80 & 73.90 & 189.60 & 788.10 & 80.10 \\ \hline 4.00 & 18.30 & 53.10 & 245.70 & 35.90 \\ \hline 16.80 & 55.60 & 136.40 & 542.30 & 79.70 \\ \hline 0.30 & 2.40 & 1.70 & 7.60 & 5.70 \\ \hline 0.30 & 2.40 & 1.50 & 7.50 & 5.60 \\ \hline 58.00 & 136.80 & 277.10 & 748.60 & 99.90 \\ \hline 17.80 & 51.50 & 111.40 & 285.80 & 76.10 \\ \hline 6.50 & 14.50 & 30.10 & 79.90 & 85.70 \\ \hline 2.80 & 6.50 & 13.50 & 40.40 & 69.30 \\ \hline 2.60 & 4.90 & 8.30 & 19.00 & 88.80 \\ \hline 3.90 & 8.80 & 20.60 & 59.60 & 76.80 \\ \hline 1.20 & 2.00 & 3.70 & 10.10 & 44.70 \\ \hline 2.60 & 4.20 & 6.50 & 21.10 & 92.00 \\ \hline 1.60 & 3.50 & 6.40 & 19.20 & 86.50 \\ \hline 0.20 & 0.20 & 0.40 & 1.80 & 9.20 \\ \hline 3.30 & 7.60 & 14.40 & 38.30 & 88.00 \\ \hline 15.40 & 33.10 & 61.90 & 173.40 & 99.30 \\ \hline 78.80 & 210.70 & 466.70 & 1536.70 & 100.00 \\ \hline 2.60 & 20.60 & 49.00 & 173.50 & 99.80 \\ \hline & & & & \\ \hline 143.90 & 201.40 & 381.90 & 1141.90 & \\ \hline 60.30 & 96.00 & 191.70 & 619.00 & \\ \hline 5.70 & 19.70 & 45.80 & 227.20 & \\ \hline 2.00 & 3.50 & 7.10 & 39.10 & \\ \hline 52.60 & 72.90 & 138.80 & 352.70 & \\ \hline 58.70 & 91.70 & 154.30 & 444.40 & \\ \hline 24.90 & 13.60 & 35.80 & 78.40 & \\ \hline 107.10 & 152.00 & 261.40 & 678.30 & \\ \hline 54.50 & 77.20 & 135.90 & 372.70 & \\ \hline 5.90 & 10.10 & 13.70 & 28.30 & \\ \hline 48.60 & 67.10 & 122.20 & 344.40 & \\ \hline 52.60 & 74.80 & 125.50 & 305.60 & \\ \hline 36.80 & 49.40 & 120.50 & 463.60 & \\ \hline \end{tabular} Balance sheet Total assets Total current assets Accounts receivable Closing inventory Other current assets Net tangible and intangible assets All other assets and adjustments Total liabilities Total current liabilities Current bank loans Other current liabilities Long term liabilities Total equity 5 of dollars) 467.2c 241.8C 74.6 12.9 154.3 187.3 38.2C 299.7 160.1 14.5 167.6 47 FINANCIAL RATIOS - DO NOT USE IN LAB, calculate own Current ratio Debt to equity ratio Interest coverage ratio Debt ratio Revenue to equity ratio Revenue to closing inventory ratio Current debt to equity (\%) Net profit to equity (\%) Net fixed assets to equity (\%) Gross margin (\%) Return on total assets (\%) Collection period for accounts receivable (days) Averages B Averages 1.50 C D E F 41 48 49 50 51 52 53 54 55 56 57 58 59 60 61 62 63 64 65 66 67 68 69 70 71 72 73 74 A 1.80 1.10 15.50 2.90 1.20 3.10 11.40 0.80 4.70 66.80 156.40 41.80 185.70 67.20 11.20 31.10 \begin{tabular}{|r|} 1.40 \\ 2.20 \\ 14.30 \\ 0.70 \\ 4.30 \\ 72.80 \\ 112.80 \\ 40.70 \\ 128.10 \\ 62.40 \\ 13.80 \\ \hline 32.40 \end{tabular} 1.701.5018.300.603.7043.7080.4037.4095.9053.1016.1048.50 Profile Revenue range Annual revenues $30,000 - $5,000,000 Provinces / Territory / Canada Ontario Incorporation status Incorporated businesses Note: Balance sheet information is only available for incorporated businesses under the incorporation status. Distribution by Total revenue Value in Thousands of dollars Data year: 2020 Industry NAICS 561730 - Landscaping services Legend for quality Indicators: A= Excellent B= Very good C= Good D= Acceptable E=Use with caution Krazy's Landscaping Financial Statements As at December 31, 2021 REVENUES AND EXPENSES Total revenue Cost of sales (direct expenses) Operating expenses (indirect expenses) Labour and commissions Amortization and depletion Repairs and maintenance Utilities and telephone/telecommunication Rent Interest and bank charges Professional and business fees Advertising and promotion Delivery, shipping and warehouse expenses Insurance Other expenses Total expenses Net profit/loss BALANCE SHEET Total assets Total current assets Accounts receivable Closing inventory Other current assets Net fixed assets Other assets and adjustments Total liabilities Total current liabilities Current bank loans Other current liabilities Long term liabilities Total equity Use proper quartile for benchmark! Source: Statistics Canada - Small business profiles, Quartiles: Whole industry (reliability) \begin{tabular}{l} \begin{tabular}{l} Bottom \\ quartile \\ (25%) \end{tabular} \\ \hline \end{tabular} 4485 Number of businesses Revenue range: Low Value ($000) High Value ($000) 30 5000 Revenues and expenses Total revenue Sales of goods and services All other revenues Cost of sales (direct expenses) Wages and benefits Purchases, materials and sub-contracts Opening inventory Closing inventory Operating expenses (indirect expenses) Labour and commissions Amortization and depletion Repairs and maintenance Utilities and telephone/telecommunication Rent Interest and bank charges Professional and business fees Advertising and promotion Delivery, shipping and warehouse expenses Insurance Other expenses Total expenses Net profit/loss 5 of dollars) 634.7c 621.7C 13.0B 268.1C 80.3C 187.8C 3. 0C 2.9C 305.1 116.6C 32.7C 15.8C 8.7 23.2c 4.2 8.6 7.75 0.6 15.9C 71.0 573.2C 61.4C 30 142 \begin{tabular}{|l|} 142 \\ 339 \end{tabular} \begin{tabular}{|l|l|} \hline 339 & 766 \\ \hline 766 & 5000 \end{tabular} \begin{tabular}{|l|l|} \begin{tabular}{l} Lower \\ middle \\ (25%) \end{tabular} & \begin{tabular}{l} Upper \\ middle \\ (25%) \end{tabular} \\ \hline \end{tabular} \begin{tabular}{|l|l} \hline \begin{tabular}{l} Top \\ quartile \\ (25%) \end{tabular} & \begin{tabular}{l} Percentage of \\ businesses \\ reporting \end{tabular} \\ \hline \end{tabular} ) \begin{tabular}{|c|c|c|c|c|} \hline & & & & \\ \hline 81.40 & 231.30 & 515.70 & 1710.30 & 100.00 \\ \hline 77.60 & 225.20 & 503.70 & 1680.30 & 98.70 \\ \hline 3.90 & 6.20 & 12.00 & 29.90 & 31.10 \\ \hline 20.80 & 73.90 & 189.60 & 788.10 & 80.10 \\ \hline 4.00 & 18.30 & 53.10 & 245.70 & 35.90 \\ \hline 16.80 & 55.60 & 136.40 & 542.30 & 79.70 \\ \hline 0.30 & 2.40 & 1.70 & 7.60 & 5.70 \\ \hline 0.30 & 2.40 & 1.50 & 7.50 & 5.60 \\ \hline 58.00 & 136.80 & 277.10 & 748.60 & 99.90 \\ \hline 17.80 & 51.50 & 111.40 & 285.80 & 76.10 \\ \hline 6.50 & 14.50 & 30.10 & 79.90 & 85.70 \\ \hline 2.80 & 6.50 & 13.50 & 40.40 & 69.30 \\ \hline 2.60 & 4.90 & 8.30 & 19.00 & 88.80 \\ \hline 3.90 & 8.80 & 20.60 & 59.60 & 76.80 \\ \hline 1.20 & 2.00 & 3.70 & 10.10 & 44.70 \\ \hline 2.60 & 4.20 & 6.50 & 21.10 & 92.00 \\ \hline 1.60 & 3.50 & 6.40 & 19.20 & 86.50 \\ \hline 0.20 & 0.20 & 0.40 & 1.80 & 9.20 \\ \hline 3.30 & 7.60 & 14.40 & 38.30 & 88.00 \\ \hline 15.40 & 33.10 & 61.90 & 173.40 & 99.30 \\ \hline 78.80 & 210.70 & 466.70 & 1536.70 & 100.00 \\ \hline 2.60 & 20.60 & 49.00 & 173.50 & 99.80 \\ \hline & & & & \\ \hline 143.90 & 201.40 & 381.90 & 1141.90 & \\ \hline 60.30 & 96.00 & 191.70 & 619.00 & \\ \hline 5.70 & 19.70 & 45.80 & 227.20 & \\ \hline 2.00 & 3.50 & 7.10 & 39.10 & \\ \hline 52.60 & 72.90 & 138.80 & 352.70 & \\ \hline 58.70 & 91.70 & 154.30 & 444.40 & \\ \hline 24.90 & 13.60 & 35.80 & 78.40 & \\ \hline 107.10 & 152.00 & 261.40 & 678.30 & \\ \hline 54.50 & 77.20 & 135.90 & 372.70 & \\ \hline 5.90 & 10.10 & 13.70 & 28.30 & \\ \hline 48.60 & 67.10 & 122.20 & 344.40 & \\ \hline 52.60 & 74.80 & 125.50 & 305.60 & \\ \hline 36.80 & 49.40 & 120.50 & 463.60 & \\ \hline \end{tabular} Balance sheet Total assets Total current assets Accounts receivable Closing inventory Other current assets Net tangible and intangible assets All other assets and adjustments Total liabilities Total current liabilities Current bank loans Other current liabilities Long term liabilities Total equity 5 of dollars) 467.2c 241.8C 74.6 12.9 154.3 187.3 38.2C 299.7 160.1 14.5 167.6 47 FINANCIAL RATIOS - DO NOT USE IN LAB, calculate own Current ratio Debt to equity ratio Interest coverage ratio Debt ratio Revenue to equity ratio Revenue to closing inventory ratio Current debt to equity (\%) Net profit to equity (\%) Net fixed assets to equity (\%) Gross margin (\%) Return on total assets (\%) Collection period for accounts receivable (days) Averages B Averages 1.50 C D E F 41 48 49 50 51 52 53 54 55 56 57 58 59 60 61 62 63 64 65 66 67 68 69 70 71 72 73 74 A 1.80 1.10 15.50 2.90 1.20 3.10 11.40 0.80 4.70 66.80 156.40 41.80 185.70 67.20 11.20 31.10 \begin{tabular}{|r|} 1.40 \\ 2.20 \\ 14.30 \\ 0.70 \\ 4.30 \\ 72.80 \\ 112.80 \\ 40.70 \\ 128.10 \\ 62.40 \\ 13.80 \\ \hline 32.40 \end{tabular} 1.701.5018.300.603.7043.7080.4037.4095.9053.1016.1048.50 Profile Revenue range Annual revenues $30,000 - $5,000,000 Provinces / Territory / Canada Ontario Incorporation status Incorporated businesses Note: Balance sheet information is only available for incorporated businesses under the incorporation status. Distribution by Total revenue Value in Thousands of dollars Data year: 2020 Industry NAICS 561730 - Landscaping services Legend for quality Indicators: A= Excellent B= Very good C= Good D= Acceptable E=Use with caution Krazy's Landscaping Financial Statements As at December 31, 2021 REVENUES AND EXPENSES Total revenue Cost of sales (direct expenses) Operating expenses (indirect expenses) Labour and commissions Amortization and depletion Repairs and maintenance Utilities and telephone/telecommunication Rent Interest and bank charges Professional and business fees Advertising and promotion Delivery, shipping and warehouse expenses Insurance Other expenses Total expenses Net profit/loss BALANCE SHEET Total assets Total current assets Accounts receivable Closing inventory Other current assets Net fixed assets Other assets and adjustments Total liabilities Total current liabilities Current bank loans Other current liabilities Long term liabilities Total equity Use proper quartile for benchmark
Step by Step Solution
There are 3 Steps involved in it

Get step-by-step solutions from verified subject matter experts