

Question: SOYE SET OVY DY Prepare the common-size, and common-base year of the Statement of Comprehensive Income for O'Leary Industrial Supply using the spreadsheets below Common-size
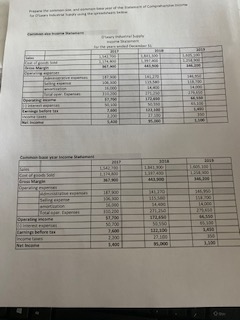
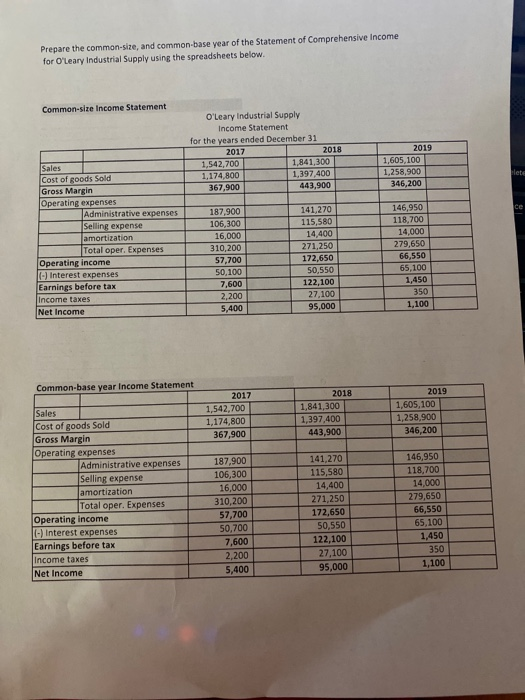
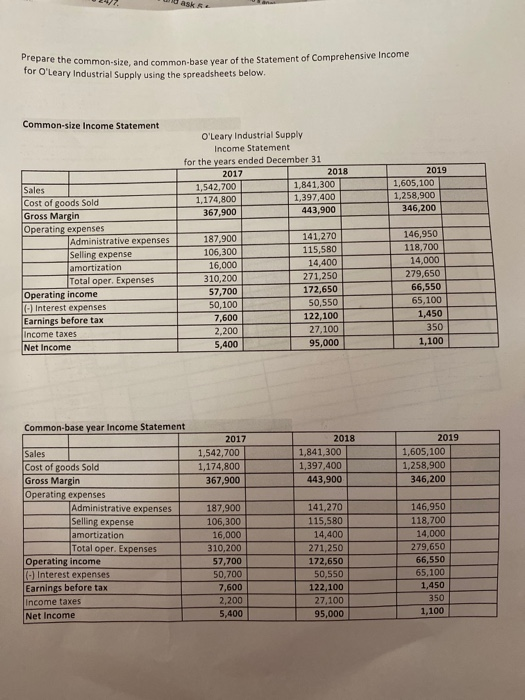
SOYE SET OVY DY Prepare the common-size, and common-base year of the Statement of Comprehensive Income for O'Leary Industrial Supply using the spreadsheets below Common-size Income Statement O'Leary Industrial Supply Income Statement for the years ended December 31 2017 2018 1,542,700 1,841,300 1,174,800 1,397,400 367.900 443,900 2019 1,605,100 1,258,900 346,200 lete ce Sales Cost of goods Sold Gross Margin Operating expenses Administrative expenses Selling expense amortization Total oper. Expenses Operating income (-) Interest expenses Earnings before tax income taxes Net Income 187,900 106,300 16,000 310,200 57,700 50,100 7,600 2,200 5,400 141,270 115,580 14,400 271,250 172,650 50,550 122,100 27.100 95,000 146,950 118,700 14,000 279,650 66,550 65,100 1,450 350 1.100 Common-base year Income Statement 2017 1,542,700 1,174,800 367,900 2018 1,841,300 1,397,400 443,900 2019 1,605,100 1,258.900 346,200 Sales Cost of goods Sold Gross Margin Operating expenses Administrative expenses Selling expense amortization Total oper. Expenses Operating income (-) Interest expenses Earnings before tax Income taxes Net Income 187,900 106,300 16,000 310,200 57,700 50,700 7,600 2,200 5,400 141,270 115,580 14,400 271,250 172,650 50,550 122,100 27.100 95,000 146,950 118,700 14,000 279,650 66,550 65,100 1,450 350 1,100 ask. Prepare the common-size, and common-base year of the Statement of Comprehensive Income for O'Leary Industrial Supply using the spreadsheets below. Common-size Income Statement O'Leary Industrial Supply Income Statement for the years ended December 31 2017 2018 1,542,700 1,841,300 1,174,800 1,397,400 367,900 443,900 2019 1,605,100 1,258,900 346,200 Sales Cost of goods Sold Gross Margin Operating expenses Administrative expenses Selling expense amortization Total oper. Expenses Operating income (-) Interest expenses Earnings before tax Income taxes Net Income 187,900 106,300 16,000 310,200 57,700 50,100 7,600 2,200 5,400 141,270 115,580 14,400 271,250 172,650 50,550 122,100 27,100 95,000 146,950 118,700 14,000 279,650 66,550 65,100 1,450 350 1,100 Common-base year Income Statement 2017 1,542,700 1,174,800 367,900 2018 1,841,300 1,397,400 443,900 2019 1,605,100 1,258,900 346,200 Sales Cost of goods Sold Gross Margin Operating expenses Administrative expenses Selling expense amortization Total oper. Expenses Operating income (-) Interest expenses Earnings before tax income taxes Net Income 187,900 106,300 16,000 310,200 57,700 50,700 7,600 2,200 5,400 141,270 115,580 14,400 271,250 172,650 50.550 122,100 27,100 95,000 146,950 118,700 14,000 279,650 66,550 65,100 1,450 350 1,100
Step by Step Solution
There are 3 Steps involved in it

Get step-by-step solutions from verified subject matter experts