

Question: SPACE Matrix Include five ( and only five ) factors to assess cach SPACE axis: Financial Position ( FP ) , Stability Position ( SP
SPACE Matrix
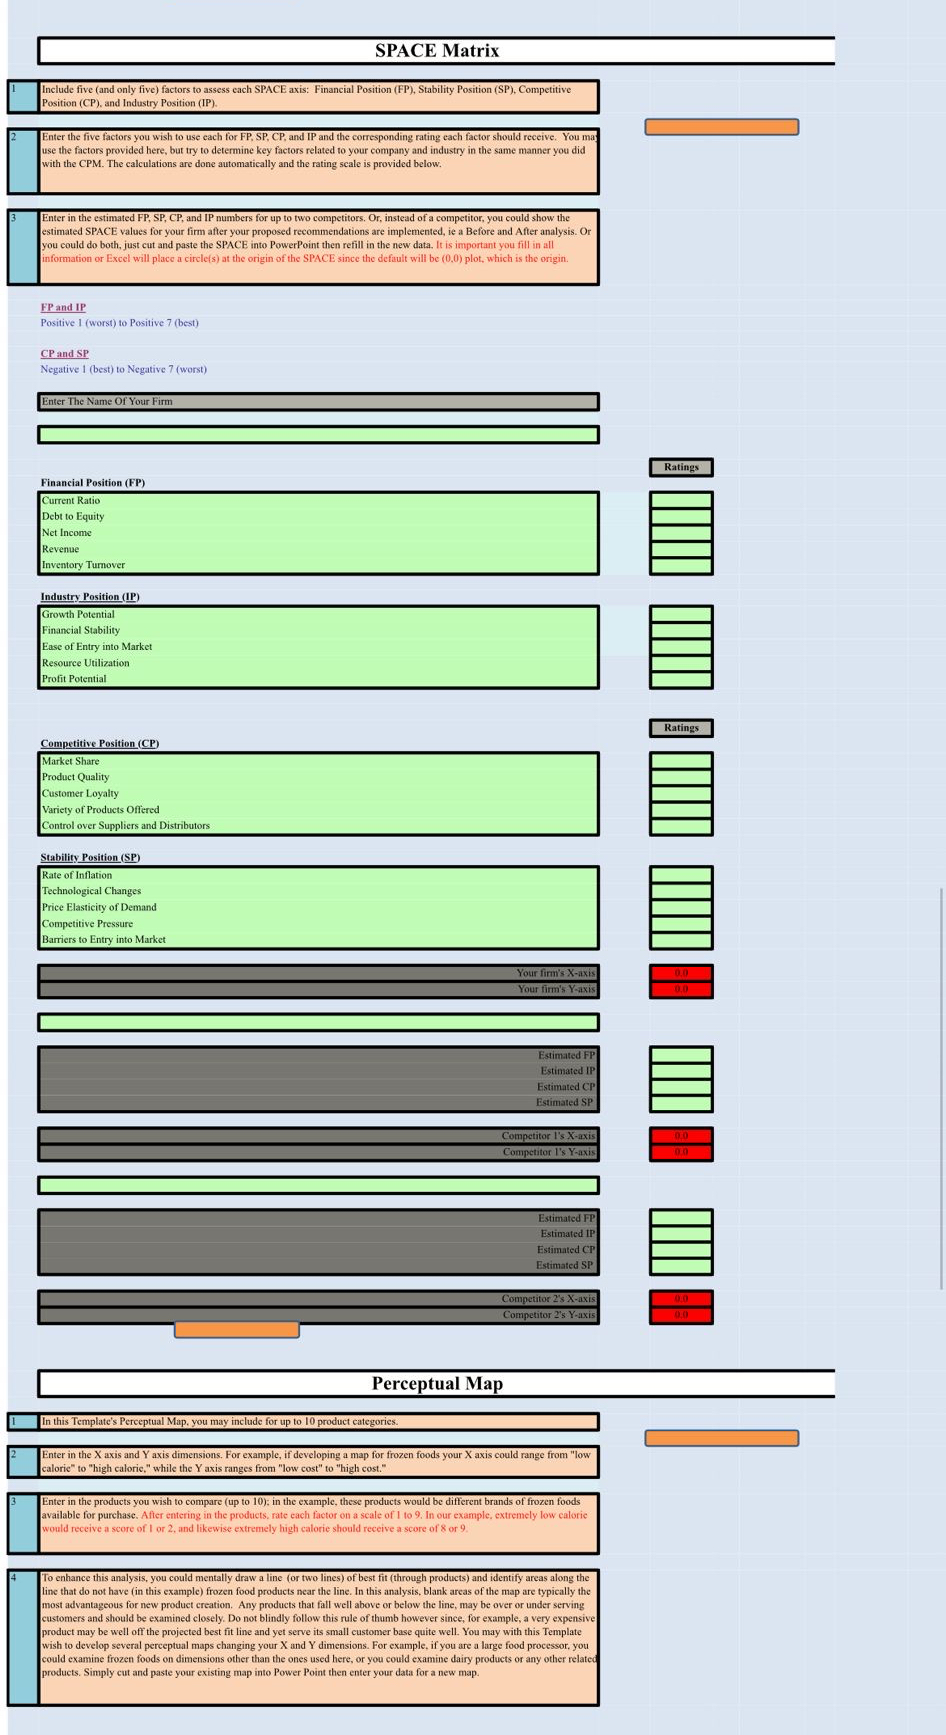
Include five and only five factors to assess cach SPACE axis: Financial Position FP Stability Position SP Competitive Position CP and Industry Position IP
Enter the five factors you wish to use each for FP SP CP and IP and the corresponding rating each factor should receive. You use the factors provided here, but try to determine key factors related to your company and industry in the same manner you did with the CPM The calculations are done automatically and the rating scale is provided below,
Enter in the estimated FP SP CP and IP numbers for up to two competitors. Or instead of a competitor, you could show the estimated SPACE values for your firm after your proposed recommendations are implemented, ie a Before and After analysis. Or you could do both, just cut and paste the SPACE into PowerPoint then refill in the new data. It is important you fill in all information or Excel will place a circles at the origin of the SPACE since the default will be plot, which is the origin.
FP and IP
Positive worst to Positive best
CP and SP
Negative best to Negative worst
Enter The Name Of Your Firm
tableFinancial Position FPtableCurrent RatioDebt to EquityNet IncomeRevenueInventory Turnover
Ratings
Industry Position IP
tableGrowth PotentialFinancial StabilityEase of Entry into MarketResource UtilizationProfit Potential
Rating:
Competitive Position CP
tableMarket ShareProduct QualityCustomer LoyaltyVariety of Products OfferedControl over Suppliers and Distributors
Stability Position SP
tableRate of InflationTechnological ChangesPrice Elasticity of DemandCompetitive PressureBarriers to Entry into Market
tableYour firm's Xaxis
table
Perceptual Map
In this Template's Pereeptual Map, you may include for up to product categories.
Enter in the axis and axis dimensions. For example, if developing a map for frozen foods your axis could range from "low caloric" to "high caloric," while the axis ranges from "low cost" to "high cost."
Enter in the products you wish to compare up to : in the example, these products would be different brands of frozen foods available for purchase. After entering in the products, rate each factor on a scale of In our example, extremely low ealoric would receive a score of I or and likewise extremely high calorie should receive a score of or
To enhance this analysis, you could mentally draw a line or two lines of best fit through products and identify areas along the line that do not have in this example frozen food products near the line. In this analysis, blank arceas of the map are typically the most advantageous for new product creation. Any products that fall well above or below the line, may be over or under serving customers and should be examined closely. Do not blindly follow this rule of thumb however since, for example, a very expensive product may be well off the projected best fit line and yet serve its small customer base quite well. You may with this Template wish to develop several perceptual maps changing your and dimensions. For example, if you are a large food processor, you could examine frozen foods on dimensions other than the ones used here, or you could examine dairy products or any other related products. Simply cut and paste your existing map into Power Point then enter your data for a new map.
My firm is JPmorgan
Step by Step Solution
There are 3 Steps involved in it
1 Expert Approved Answer
Step: 1 Unlock

Question Has Been Solved by an Expert!
Get step-by-step solutions from verified subject matter experts
Step: 2 Unlock
Step: 3 Unlock