

Question: 1 = the response is poor 2 = the response is average 3 = the response is above average 4 = the response is superior
"the response is poor"
"the response is average"
"the response is above average
"the response is superior"
Enter Factors Below
tableAdvertisingDomestic Market PenetrationCustomer ServiceProduct VarietyInternational Market PenetrationEmployee DedicationFinancial ProfitCustomer LoyaltyMarket ShareProduct QualityTop ManagementPrice Competitiveness
Enter Ratings Below
Boston Consulting Group BCG Matrix
This Template allows for up to divisions. If your company has more than divisions, combine the divisions with the least amount of revenue into division and mention the adjustment to the class during your presentation, or simply focus on the divisions your year plan centers around; check with your professor. SSee your firm's Form K or Annual Report to find divisional information, and those documents of your rivals It is excellent to develop a BCGIE by geographic region, and construct another one by product if you have data
In each division, enter a name, followed by the dollar amount in revenues for that division. Do not include or B for millions or billions, but do drop off zeros. For example, for $ you could enter $ or $ just be consistent.
After completing Step in developing a BCG enter in the dollar amount in revenues for the top rival firm for each division. Note, the top rival may be you and in this situation enter in your company's revenue for that division. Also, note the top rival may be different for different divisions. For example, if your firm is Avon, Avon's top rival in its lipstick division may be Revlon, but for nail polish, the top rival in the industry may be L'Oral and in makeup, Avon may be the market leader. There is no need to label the top rival by name, but you could mention in class as part of your presentation. Be sure to enter in all numbers in the same $ format you used in Step above. If you do not have a perfect apples to apples comparison, possibly a rival firm combines lipstick and makeup, where your firm separates the two then estimate as best you can and make note in your presentation.
Finally, enter in the industry growth rate IGR for each division. Generally, taking the top or rivals for each division along with your firm adding their numbers together for the current year and the previous year and using the equation Current Year Previous Year Previous Year is sufficient to estimate guess of the industry growth rate. This is because generally the top players dominate an industry. Note, using this process also weights larger firms more, which is exactly what you desire. Do not use total revenues; instead, use divisional revenues. Division industry growth rates IGR must be between and If outside these ranges, simply use or and mention during your presentation.
Everything is calculated and positioned for you Other than Industry Growth Rate in Step including the Relative Market
Share Position RMSP The BCG matrix in this Template does not produce pie slices to show profits. You may wish to
discuss divisional profits in your presentation.
Enter in division names below If less than leave the other spaces blank and no circles will appear
Your Firm's
Division
Revenues
BCG
Top Firm in Industry Division Revenues
Division
Market Growth
Rate Step
Internal External IE Matrix
This Template allows for up to divisions. If the company has more than divisions, combine the divisions with the least amount of revenue into division and mention the adjustment to the class during your presentation, or simply focus on the divisions that your year plan centers around; check with your professor.
Company wide EFE and IFE scores are automatically entered once you complete the EFE and IFE Matrices.
Enter in estimated EFE and IFE Scores for your respective divisions.
This Template's IE matrix does not produce pie slices to show profits.
Enter The Name Of Your Firm
IE
Your Firm's
Enter in division names below. If less than leave the other spaces blank and no circles will appear. Remember you could use divisions by geographic region for the BCG and by productservice type for the IE or vice versa Division
Estimated Revenues IFE Score
Estimated
EFE Score
table
IE
EP and IP
Positive worst to Positive best
CP and SP
Negative best to Negative worst
Enter The Name Of Your Firm
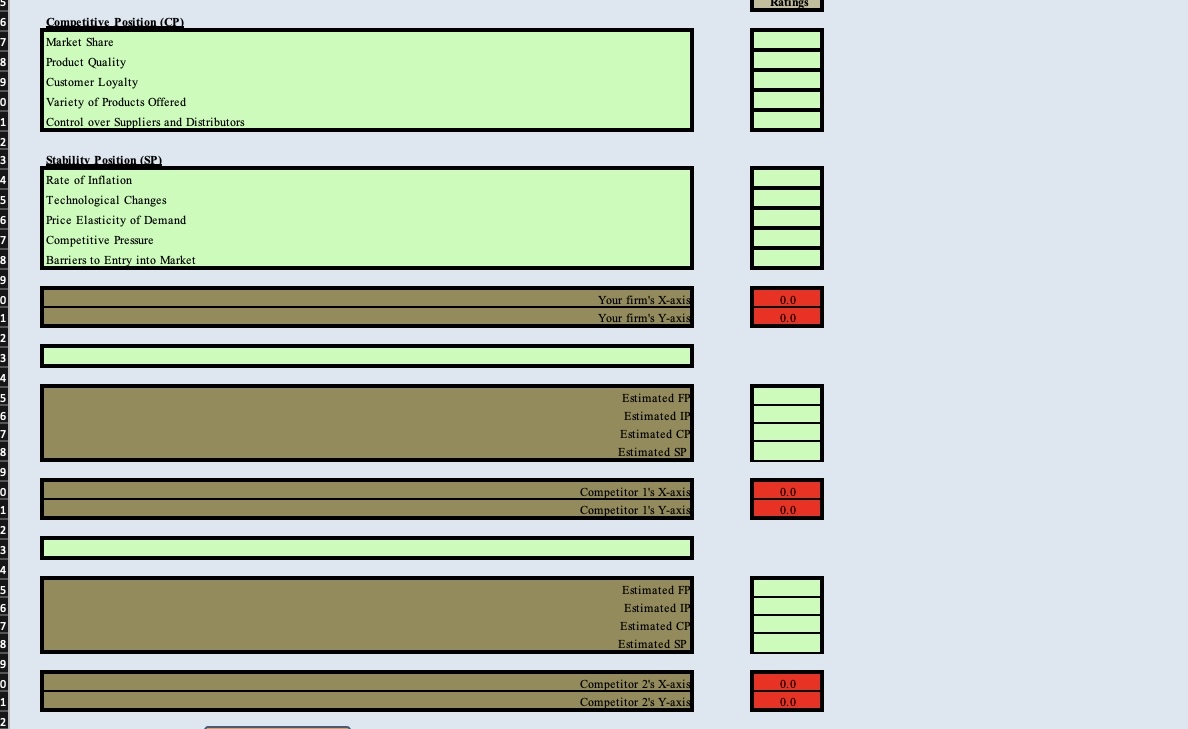
SPACE Matrix
Include five and only five factors to assess each SPACE axis: Financial Position FP Stability Position SP Competitive Position CP and Industry Position IP
Enter the five factors you wish to use each for FP SP
Step by Step Solution
There are 3 Steps involved in it
1 Expert Approved Answer
Step: 1 Unlock

Question Has Been Solved by an Expert!
Get step-by-step solutions from verified subject matter experts
Step: 2 Unlock
Step: 3 Unlock