

Question: Specifically, the data were collected from 5 different periods. For each period, the data corresponds to the yield curve for 2, 5, 10, and 30
-
Specifically, the data were collected from 5 different periods. For each period, the data corresponds to the yield curve for 2, 5, 10, and 30 years of maturity. Given historical data on the yield curve, can you identify these five dates? (5 Points) Note: To answer this, you need to download data on Treasury yields of different maturities using the FRED database. In particular, you need to download data for the following codes DGS2, DGS5, DGS10, and DGS30. After merging and dropping missing values, the final dataset is daily and should date between Jan 2nd, 2018, and Nov 4, 2021.
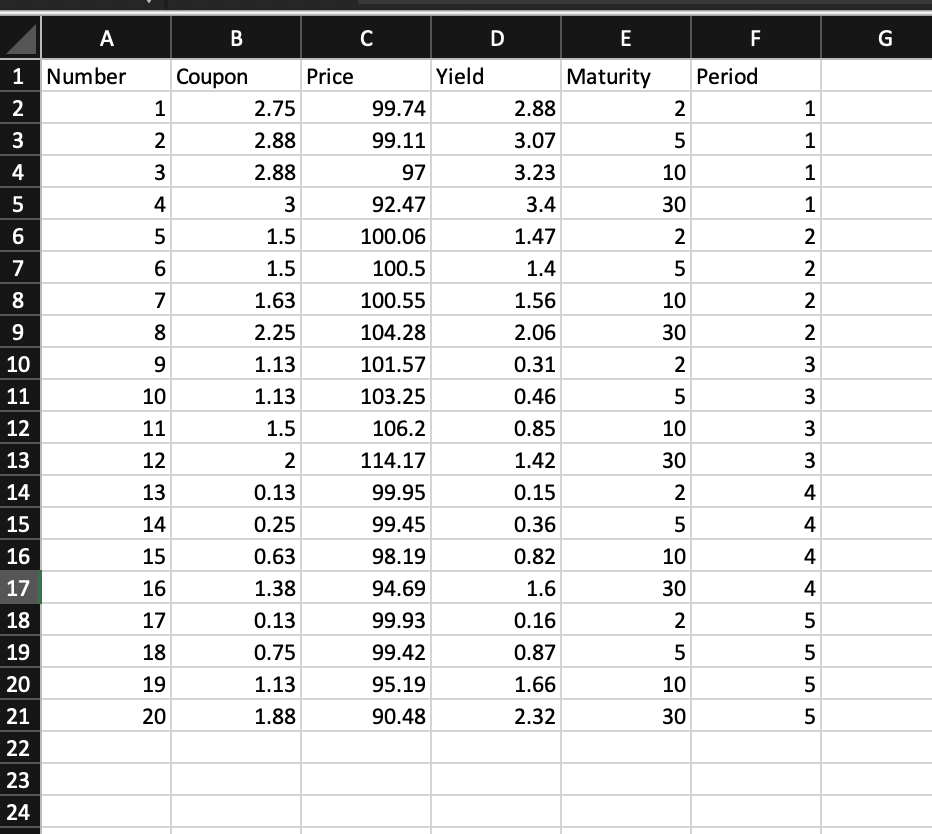
A B C D E F F G 1 Number Maturity Period N 2. 3 5 1 1 1 1 4 2.88 3.07 3.23 3.4 1.47 m 10 30 5 6 5 2. 2 2 7 1.4 5 2 8 2 1.56 2.06 0.31 10 30 2 2. 3 Coupon Price Yield 1 2.75 99.74 2 2.88 99.11 3 2.88 97 4 3 92.47 1.5 100.06 6 1.5 100.5 7 1.63 100.55 8 2.25 104.28 9 1.13 101.57 10 1.13 103.25 11 1.5 106.2 12 2 114.17 13 0.13 99.95 14 0.25 99.45 15 0.63 98.19 16 1.38 94.69 17 0.13 99.93 18 0.75 99.42 19 1.13 95.19 20 1.88 90.48 5 3 0.46 0.85 3 3 4 9 10 11 12 13 14 15 16 17 18 19 20 21 22 23 24 + 1.42 0.15 0.36 0.82 1.6 0.16 0.87 1.66 2.32 10 30 2 5 10 30 2 5 10 30 4 4 4 5 5 5 5 A B C D E F F G 1 Number Maturity Period N 2. 3 5 1 1 1 1 4 2.88 3.07 3.23 3.4 1.47 m 10 30 5 6 5 2. 2 2 7 1.4 5 2 8 2 1.56 2.06 0.31 10 30 2 2. 3 Coupon Price Yield 1 2.75 99.74 2 2.88 99.11 3 2.88 97 4 3 92.47 1.5 100.06 6 1.5 100.5 7 1.63 100.55 8 2.25 104.28 9 1.13 101.57 10 1.13 103.25 11 1.5 106.2 12 2 114.17 13 0.13 99.95 14 0.25 99.45 15 0.63 98.19 16 1.38 94.69 17 0.13 99.93 18 0.75 99.42 19 1.13 95.19 20 1.88 90.48 5 3 0.46 0.85 3 3 4 9 10 11 12 13 14 15 16 17 18 19 20 21 22 23 24 + 1.42 0.15 0.36 0.82 1.6 0.16 0.87 1.66 2.32 10 30 2 5 10 30 2 5 10 30 4 4 4 5 5 5 5
Step by Step Solution
There are 3 Steps involved in it

Get step-by-step solutions from verified subject matter experts