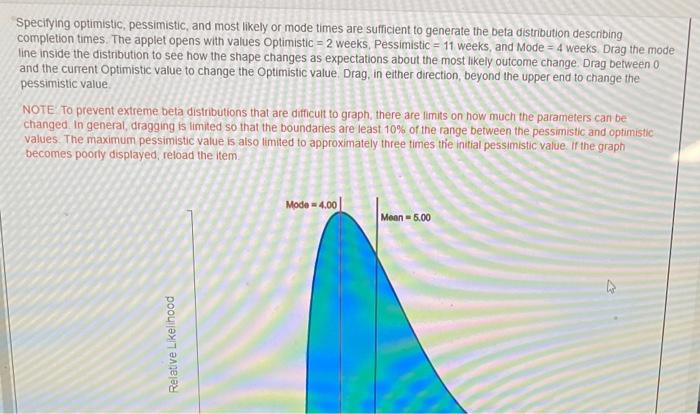
Question: Specifying optimistic, pessimistic, and most likely or mode times are sufficient to generate the beta distribution describing completion times. The applet opens with values Optimistic

Specifying optimistic, pessimistic, and most
Specifying optimistic, pessimistic, and most likely or mode times are sufficient to generate the beta distribution describing completion times. The applet opens with values Optimistic = 2 weeks, Pessimistic = 11 weeks, and Mode = 4 weeks. Drag the mode line inside the distribution to see how the shape changes as expectations about the most likely outcome change. Drag between 0 and the current Optimistic value to change the optimistic value Drag, in either direction, beyond the upper end to change the pessimistic value NOTE To prevent extreme beta distributions that are difficult to graph there are limits on how much the parameters can be changed In general, dragging is limited so that the boundaries are least 10% of the range between the pessimistic and optimistic values. The maximum pessimistic value is also limited to approximately three times thie initial pessimistic value. Ir the graph becomes poorly displayed, reload the item Mode -4.00 Mean = 5.00 W Relative Likelihood Specifying optimistic, pessimistic, and most likely or mode times are sufficient to generate the beta distribution describing completion times. The applet opens with values Optimistic = 2 weeks, Pessimistic = 11 weeks, and Mode = 4 weeks. Drag the mode line inside the distribution to see how the shape changes as expectations about the most likely outcome change. Drag between 0 and the current Optimistic value to change the optimistic value Drag, in either direction, beyond the upper end to change the pessimistic value NOTE To prevent extreme beta distributions that are difficult to graph there are limits on how much the parameters can be changed In general, dragging is limited so that the boundaries are least 10% of the range between the pessimistic and optimistic values. The maximum pessimistic value is also limited to approximately three times thie initial pessimistic value. Ir the graph becomes poorly displayed, reload the item Mode -4.00 Mean = 5.00 W Relative Likelihood

Step by Step Solution

There are 3 Steps involved in it

1 Expert Approved Answer
Step: 1 Unlock blur-text-image
Question Has Been Solved by an Expert!

Get step-by-step solutions from verified subject matter experts

Step: 2 Unlock
Step: 3 Unlock

Students Have Also Explored These Related General Management Questions!