

Question: Speedy Auto Inc would like to apply ABC analysis on 15 of its stock-keeping units, as protype test. In a table below, the annual usage
Speedy Auto Inc would like to apply ABC analysis on 15 of its stock-keeping units, as protype test. In a table below, the annual usage and unit cost for these items are shown. Determine the following:
(a) Annual dollar ($) usage for each item.
(b) List the items in descending order based on annual dollar usage.
(c) Calculate the percentage (total dollars) for each item
(d) Group the items into classes based on -percent of item value in inventory as well as based on percent of total dollar usage in inventory
(e) Draw a diagram of ......percent of item (x-axis) ------ percent of annual value ($) of items (y-axis). Note: Solve using excel.
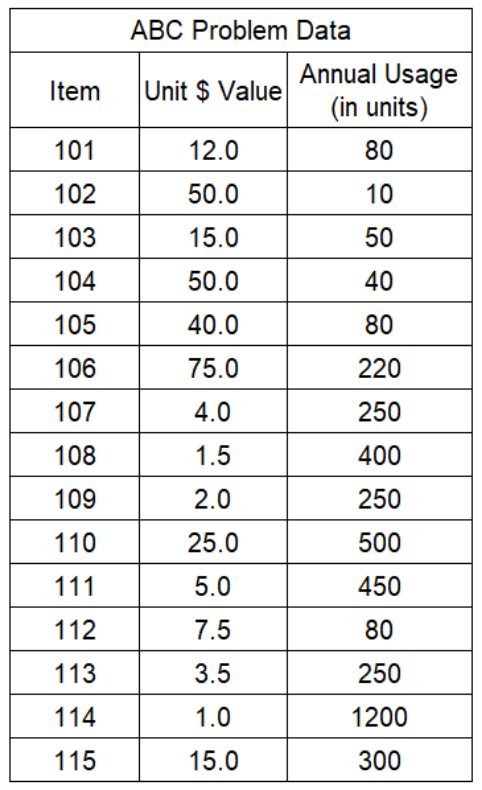
\begin{tabular}{|c|c|c|} \hline \multicolumn{3}{|c|}{ ABC Problem Data } \\ \hline Item & Unit \$ Value & AnnualUsage(inunits) \\ \hline 101 & 12.0 & 80 \\ \hline 102 & 50.0 & 10 \\ \hline 103 & 15.0 & 50 \\ \hline 104 & 50.0 & 40 \\ \hline 105 & 40.0 & 80 \\ \hline 106 & 75.0 & 220 \\ \hline 107 & 4.0 & 250 \\ \hline 108 & 1.5 & 400 \\ \hline 109 & 2.0 & 250 \\ \hline 110 & 25.0 & 500 \\ \hline 111 & 5.0 & 450 \\ \hline 112 & 7.5 & 80 \\ \hline 113 & 3.5 & 250 \\ \hline 114 & 1.0 & 1200 \\ \hline 115 & 15.0 & 300 \\ \hline \end{tabular}
Step by Step Solution
There are 3 Steps involved in it

Get step-by-step solutions from verified subject matter experts