

Question: Spinning Bar Use the data shared in this spreadsheet, along with the instructions on how to do a reduced ( chi ^ {
Spinning Bar
Use the data shared in this spreadsheet, along with the instructions on how to do a reduced chi analysis that are shared on Canvas.
Use "curve fit" on LoggerPro to do a linear fit to the data that takes the error bars into account. Report your fit parameters and uncertainties, along with the appropriate units for these constants.
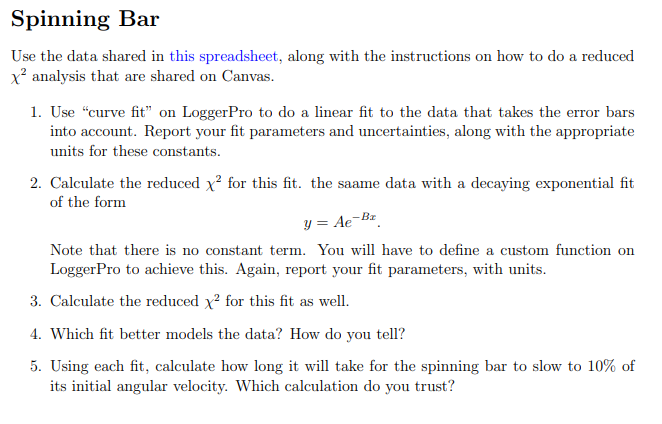
Calculate the reduced chi for this fit. the saame data with a decaying exponential fit of the form
yA eB x
Note that there is no constant term. You will have to define a custom function on LoggerPro to achieve this. Again, report your fit parameters, with units.
Calculate the reduced chi for this fit as well.
Which fit better models the data? How do you tell?
Using each fit, calculate how long it will take for the spinning bar to slow to of its initial angular velocity. Which calculation do you trust?
Step by Step Solution
There are 3 Steps involved in it
1 Expert Approved Answer
Step: 1 Unlock

Question Has Been Solved by an Expert!
Get step-by-step solutions from verified subject matter experts
Step: 2 Unlock
Step: 3 Unlock