

Question: Spring 2020 -- Math 131 Numerical Methods for Engineers and Scientists - Section 20 > Feb_4_Worksheet > Putting it together O solutions submitted (max: Unlimited)
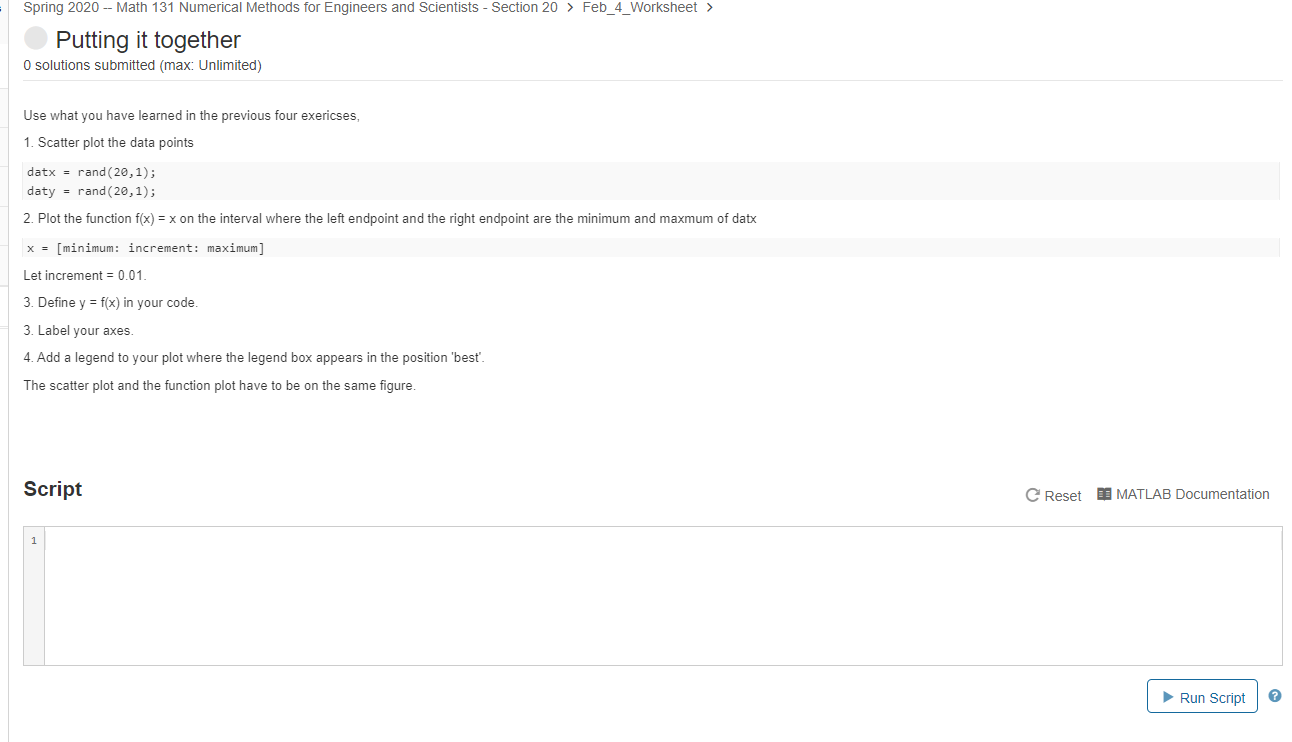
Spring 2020 -- Math 131 Numerical Methods for Engineers and Scientists - Section 20 > Feb_4_Worksheet > Putting it together O solutions submitted (max: Unlimited) Use what you have learned in the previous four exericses, 1. Scatter plot the data points datx = rand(20,1); daty = rand(20,1); 2. Plot the function f(x) = x on the interval where the left endpoint and the right endpoint are the minimum and maxmum of datx x = [minimum: increment: maximum] Let increment = 0.01 3. Define y = f(x) in your code. 3. Label your axes. 4. Add a legend to your plot where the legend box appears in the position 'best'. The scatter plot and the function plot have to be on the same figure. Script C Reset MATLAB Documentation Run Script
Step by Step Solution
There are 3 Steps involved in it

Get step-by-step solutions from verified subject matter experts