

Question: SPSS Statistics File Edit View Data Transform Insert Format Analyze Graphs Utilities Extensions Window Help Q 8 Thu May 20 3:31 PM . . .
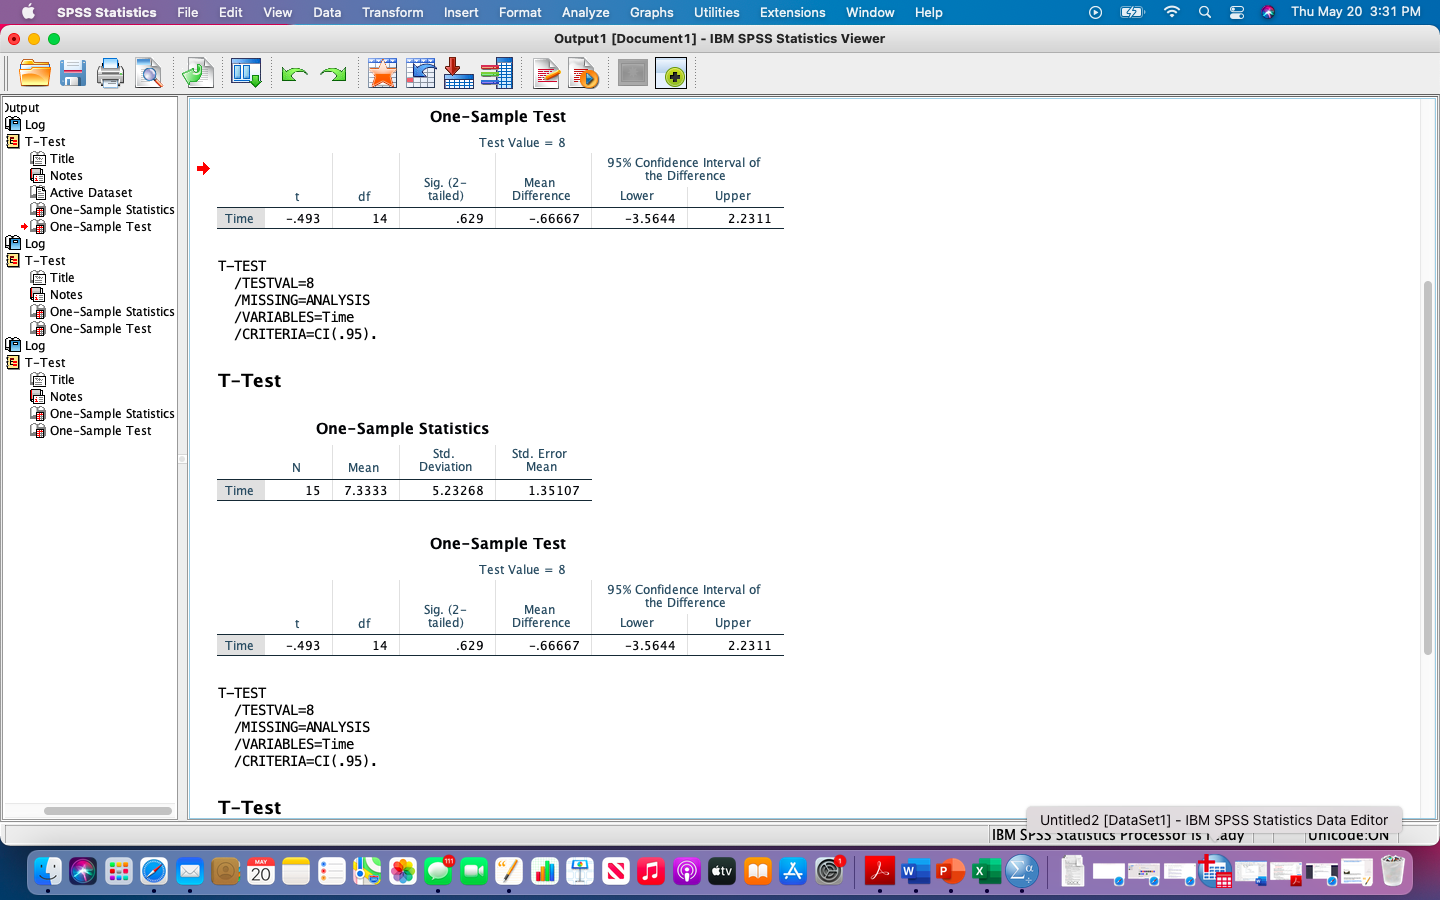
SPSS Statistics File Edit View Data Transform Insert Format Analyze Graphs Utilities Extensions Window Help Q 8 Thu May 20 3:31 PM . . . Output1 [Document 1] - IBM SPSS Statistics Viewer F ........ + ........ Output LA Log One-Sample Test T-Test Test Value = 8 Title 95% Confidence Interval of LEE Notes Sig. (2- the Difference Mean Active Dataset tailed) Difference Lower Upper One-Sample Statistics Time -.493 14 .629 -.66667 -3.5644 2.2311 *One-Sample Test Log E T-Test T-TEST Title /TESTVAL=8 Notes /MISSING=ANALYSIS One-Sample Statistics /VARIABLES=Time One-Sample Test /CRITERIA=CI ( . 95) . A Log T-Test Title T-Test ES Notes One-Sample Statistics One-Sample Test One-Sample Statistics Std. Std. Error N Mean Deviation Mean Time 15 7.3333 5.23268 1.35107 One-Sample Test Test Value = 8 95% Confidence Interval of Sig. (2- Mean the Difference if tailed) Difference Lower Upper Time -.493 14 629 -.66667 -3.5644 2.2311 T-TEST /TESTVAL=8 /MISSING=ANALYSIS /VARIABLES=Time /CRITERIA=CI ( . 95). T-Test Untitled2 [DataSet1] - IBM SPSS Statistics Data Editor IBM Sros Statistics processor is 1 .day unicode:UN MAY 20 MA G W P
Step by Step Solution
There are 3 Steps involved in it

Get step-by-step solutions from verified subject matter experts