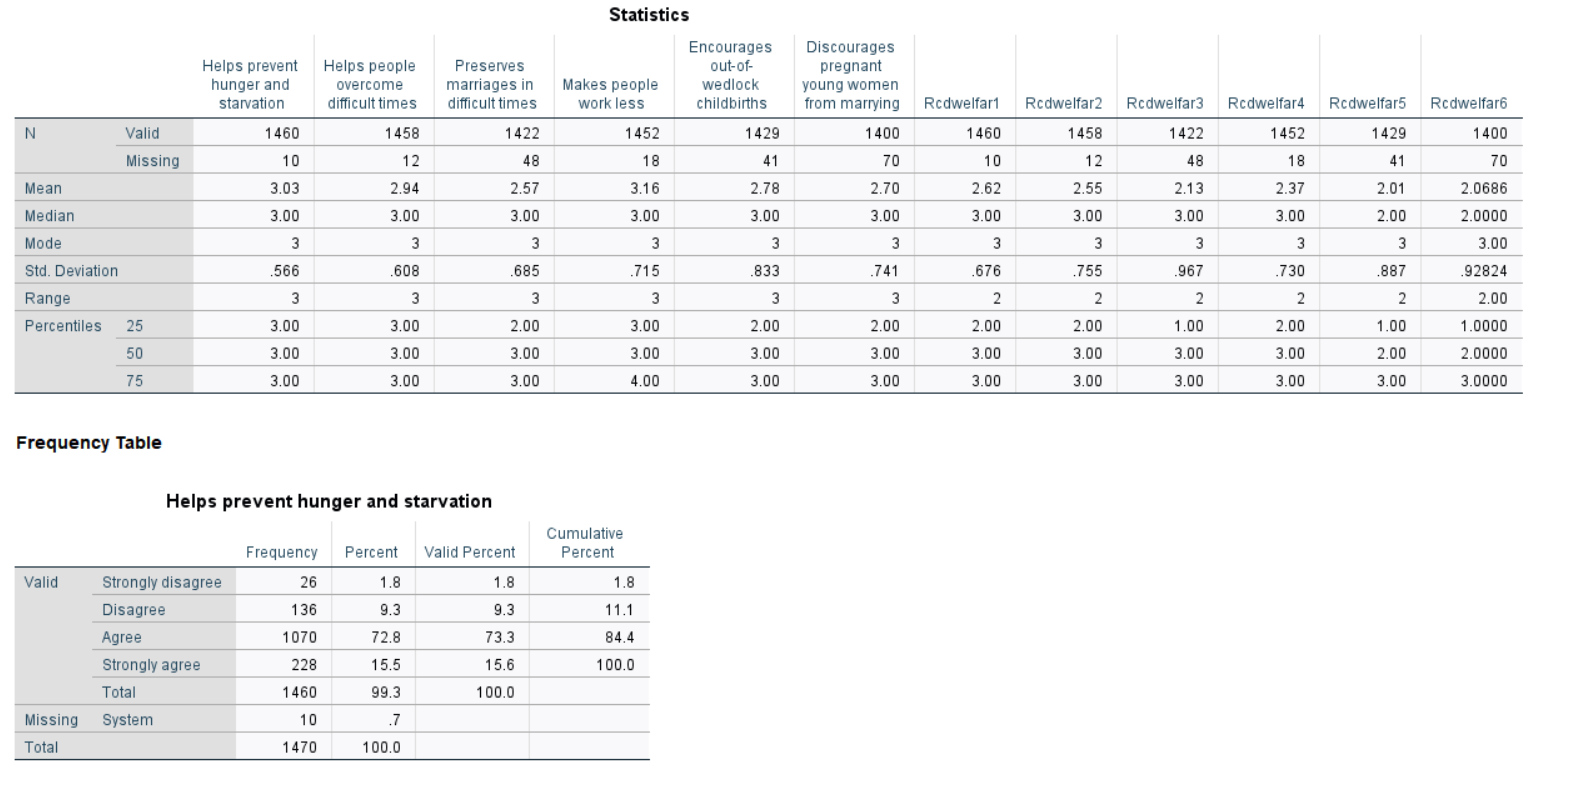
The welfare.sav dataset (available on the website) is a subsample of 1470 respondents from the 1986 General Social Survey, and includes six variables which measure various attitudes about welfare. The variable names for those variables are WELFAR1, WELFAR2, WELFAR3, WELFAR4, WELFAR5, and WELFAR6. You will explore both univariate descriptive analysis of those measures, as well as differences among the six. (Remember "valence" from lecture?)
Note: Use the original variables for the first five questions, and the recoded variables only for questions 6, 7, and 8.
Instructions
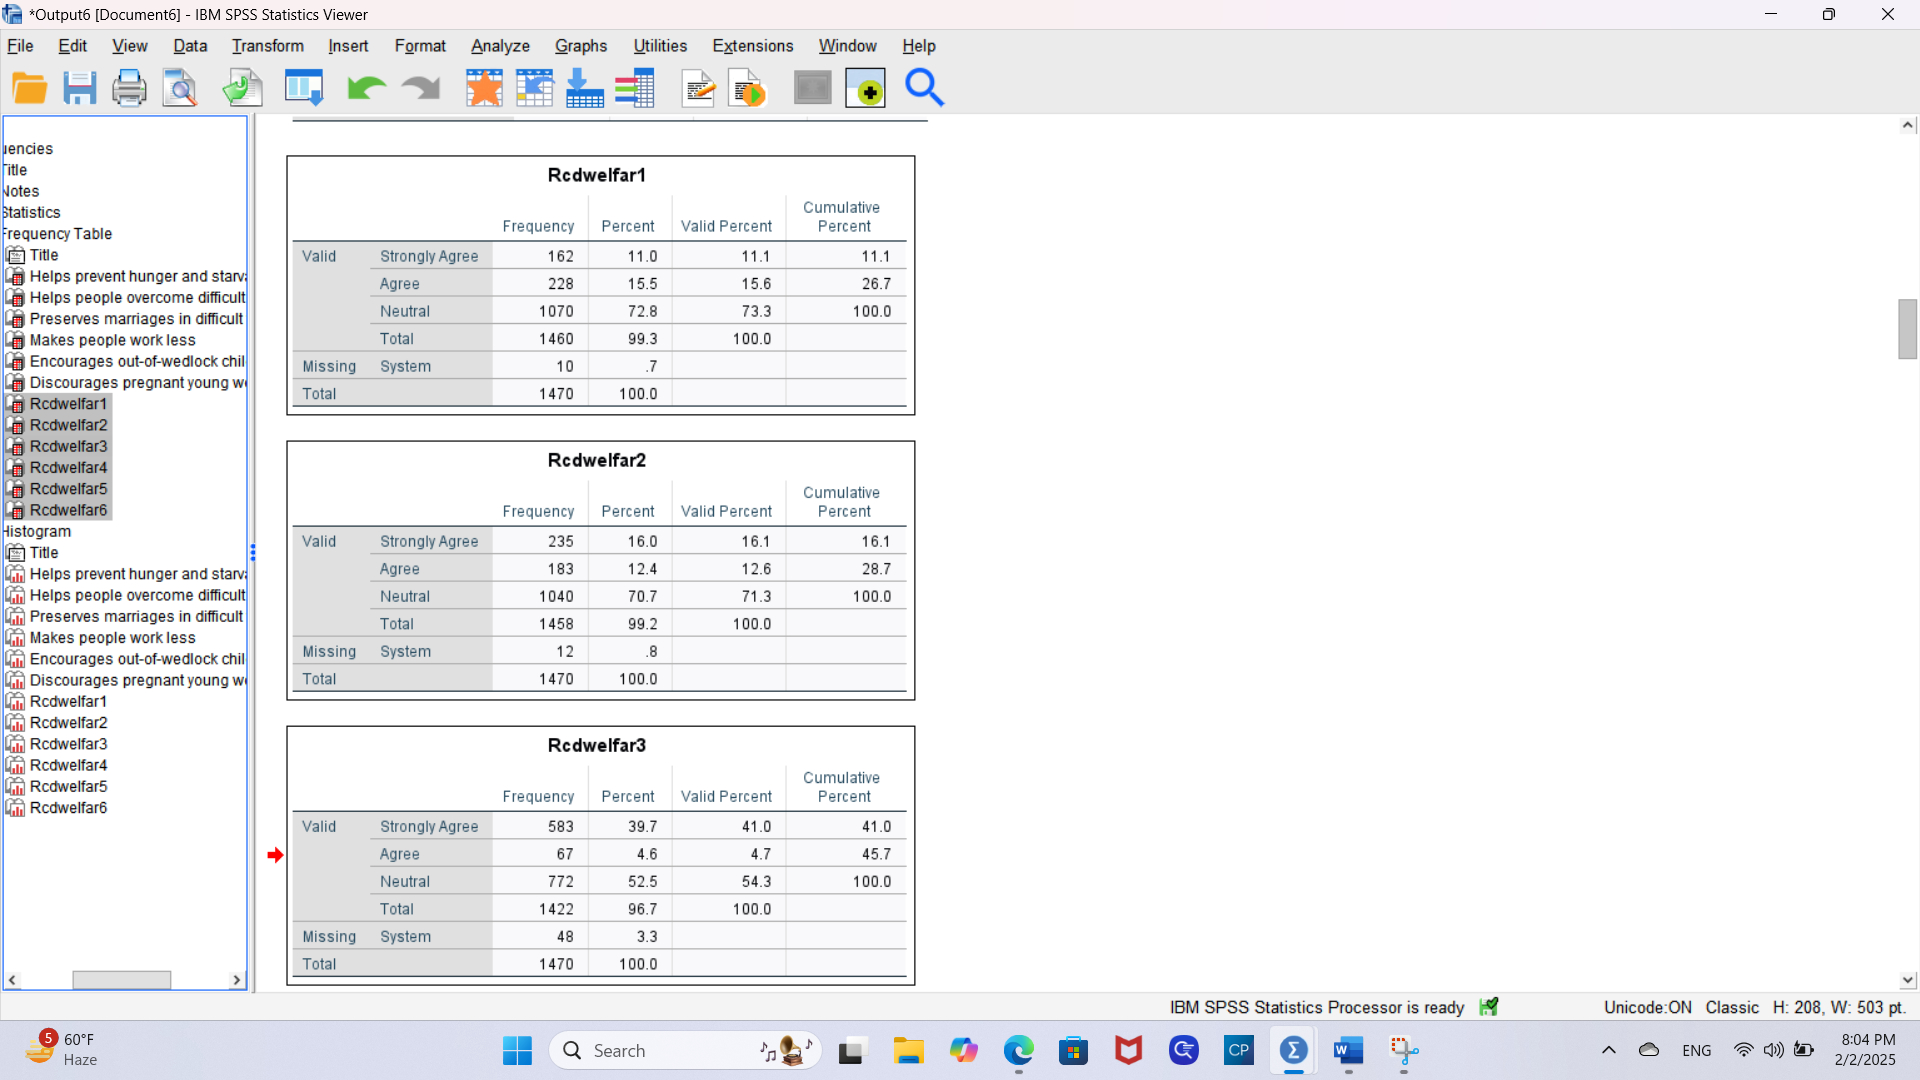
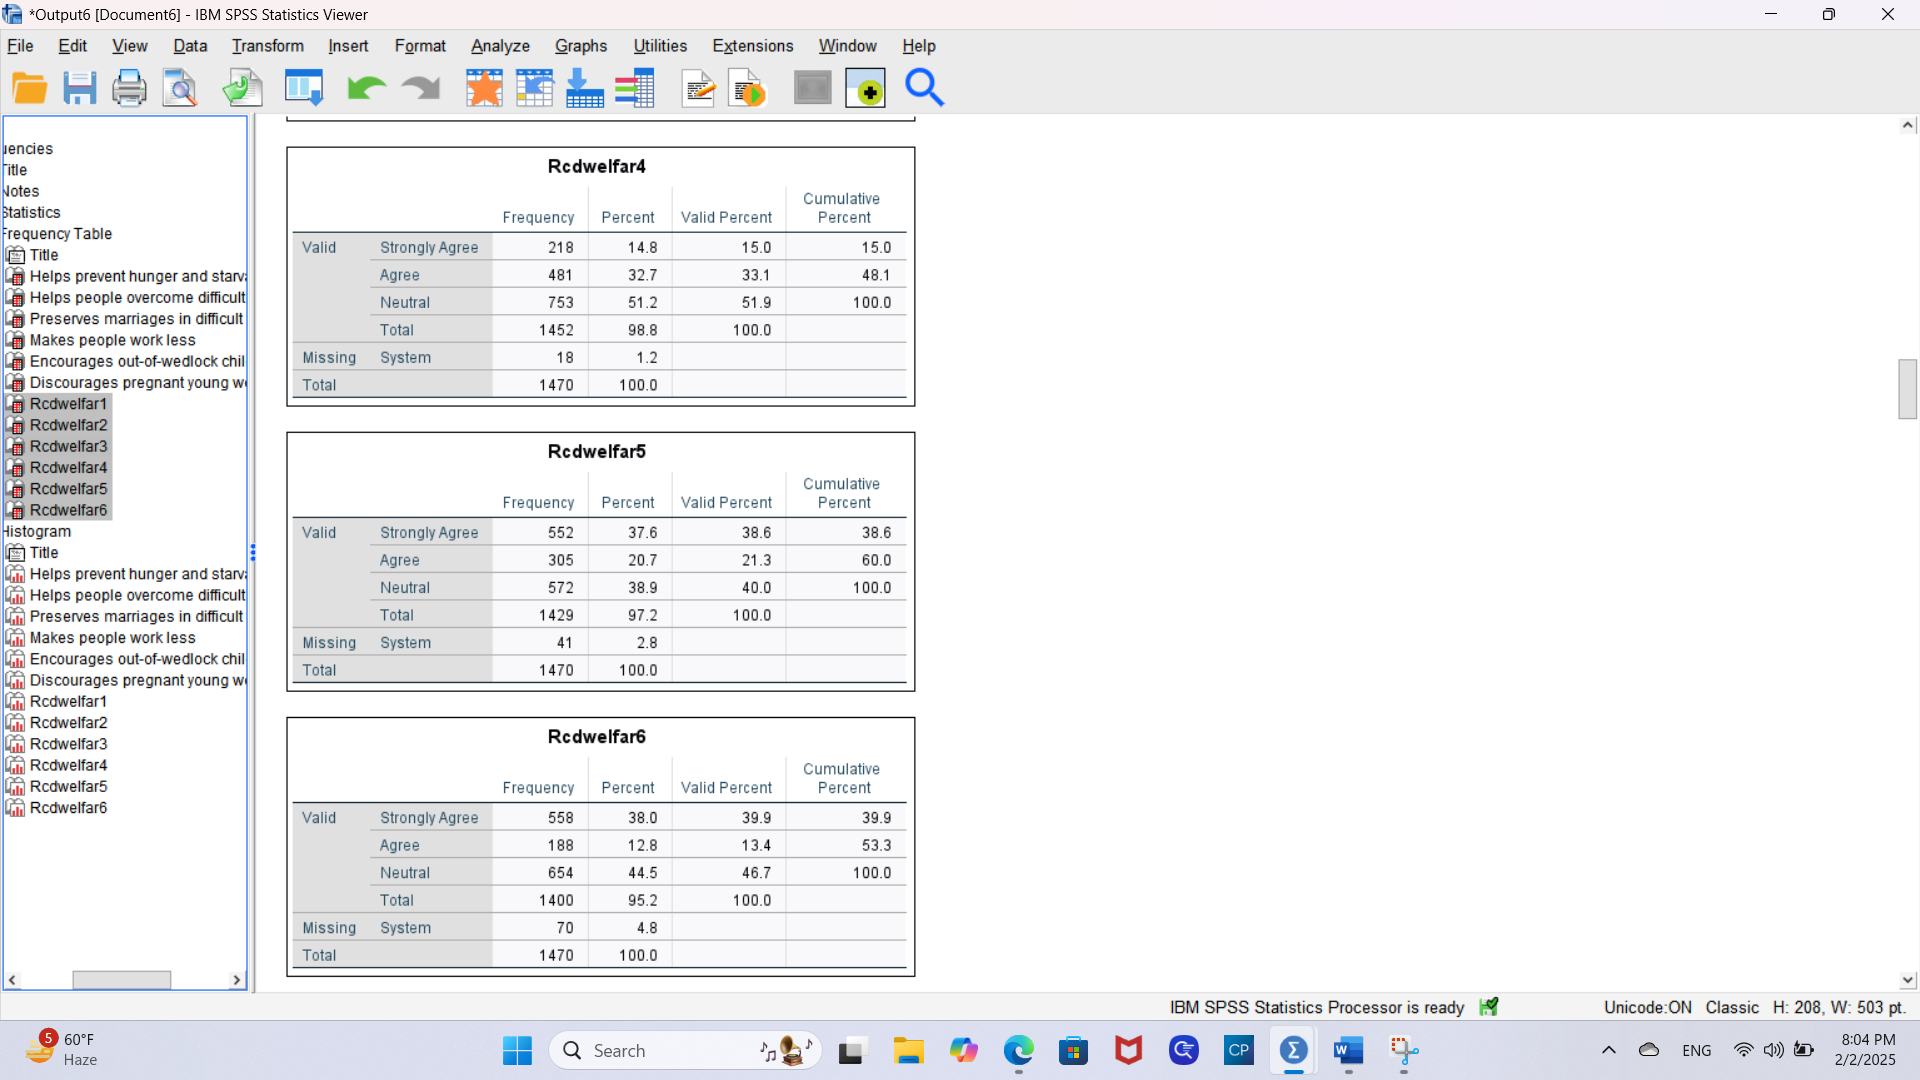
1. For all six variables, use a RECODE procedure to combine "strongly agree" and "agree" into one category, and "disagree" and "strongly disagree" into a second category.
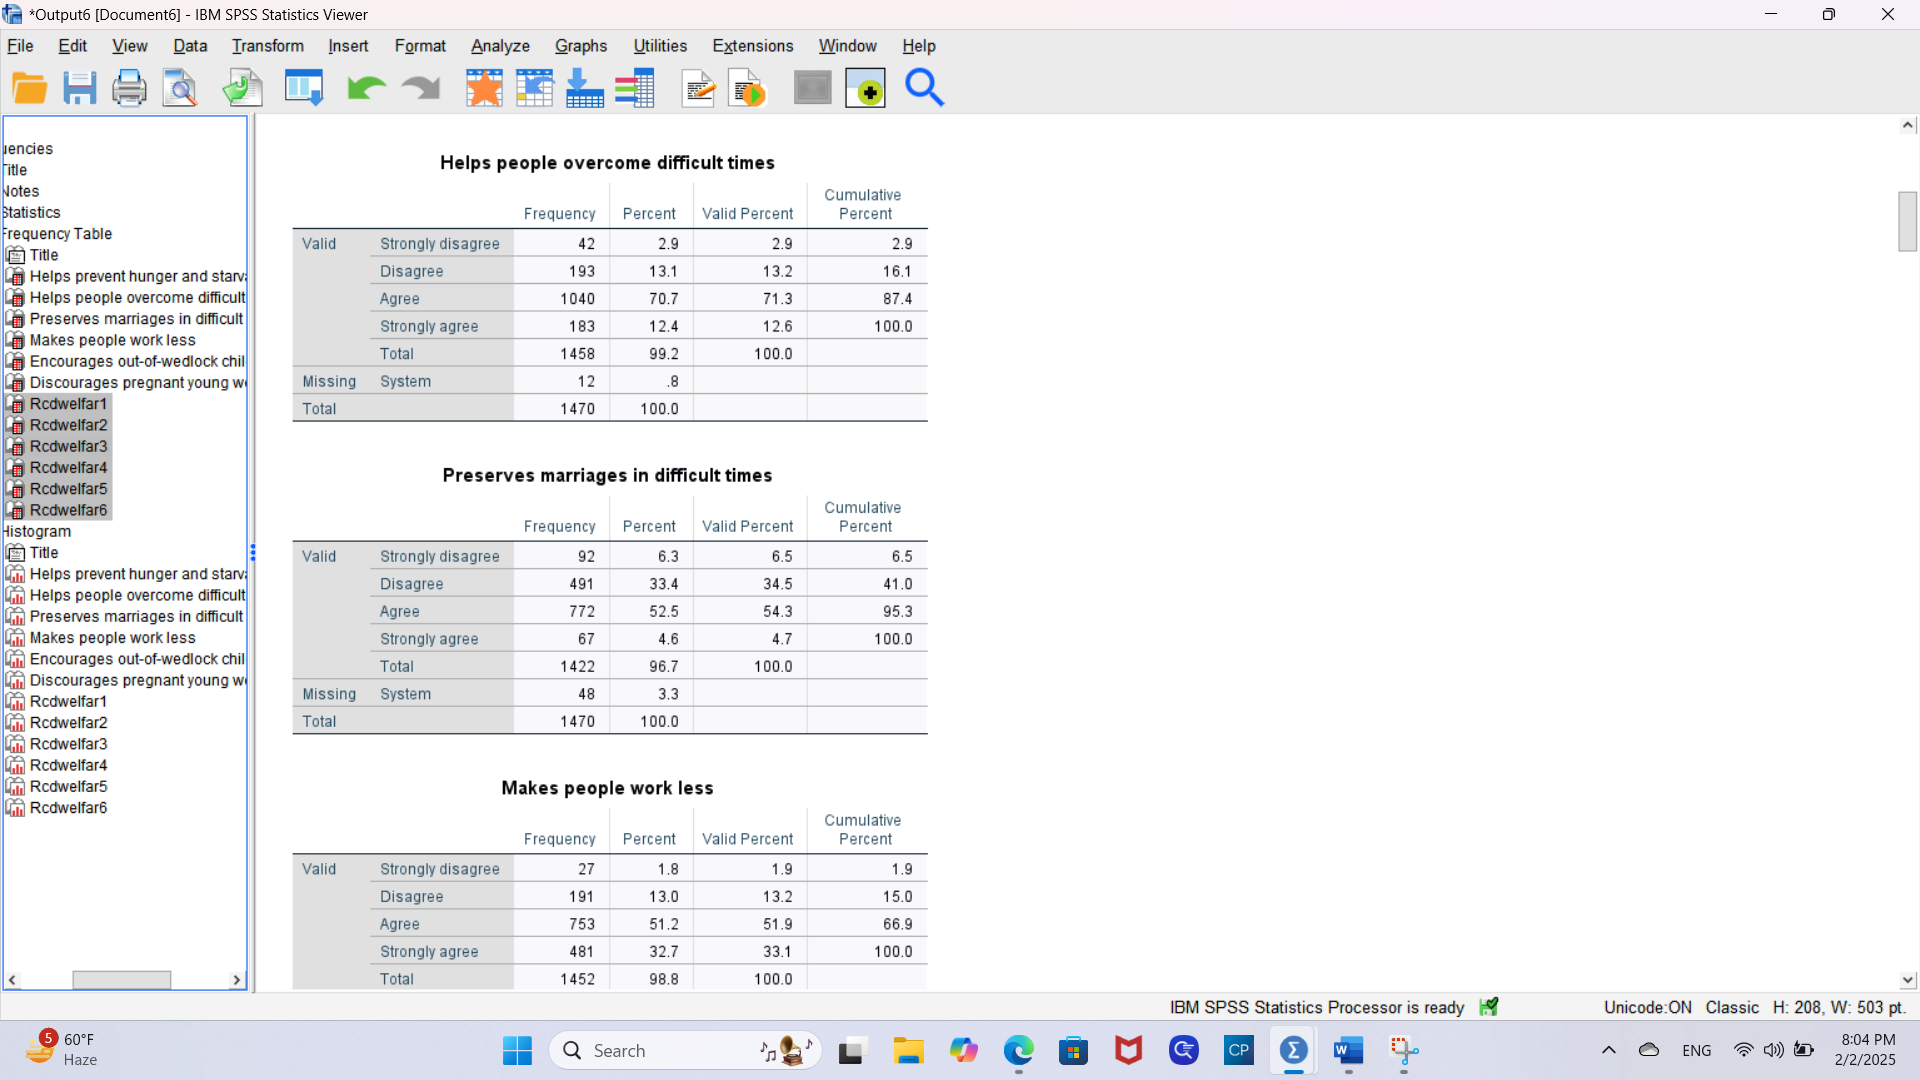
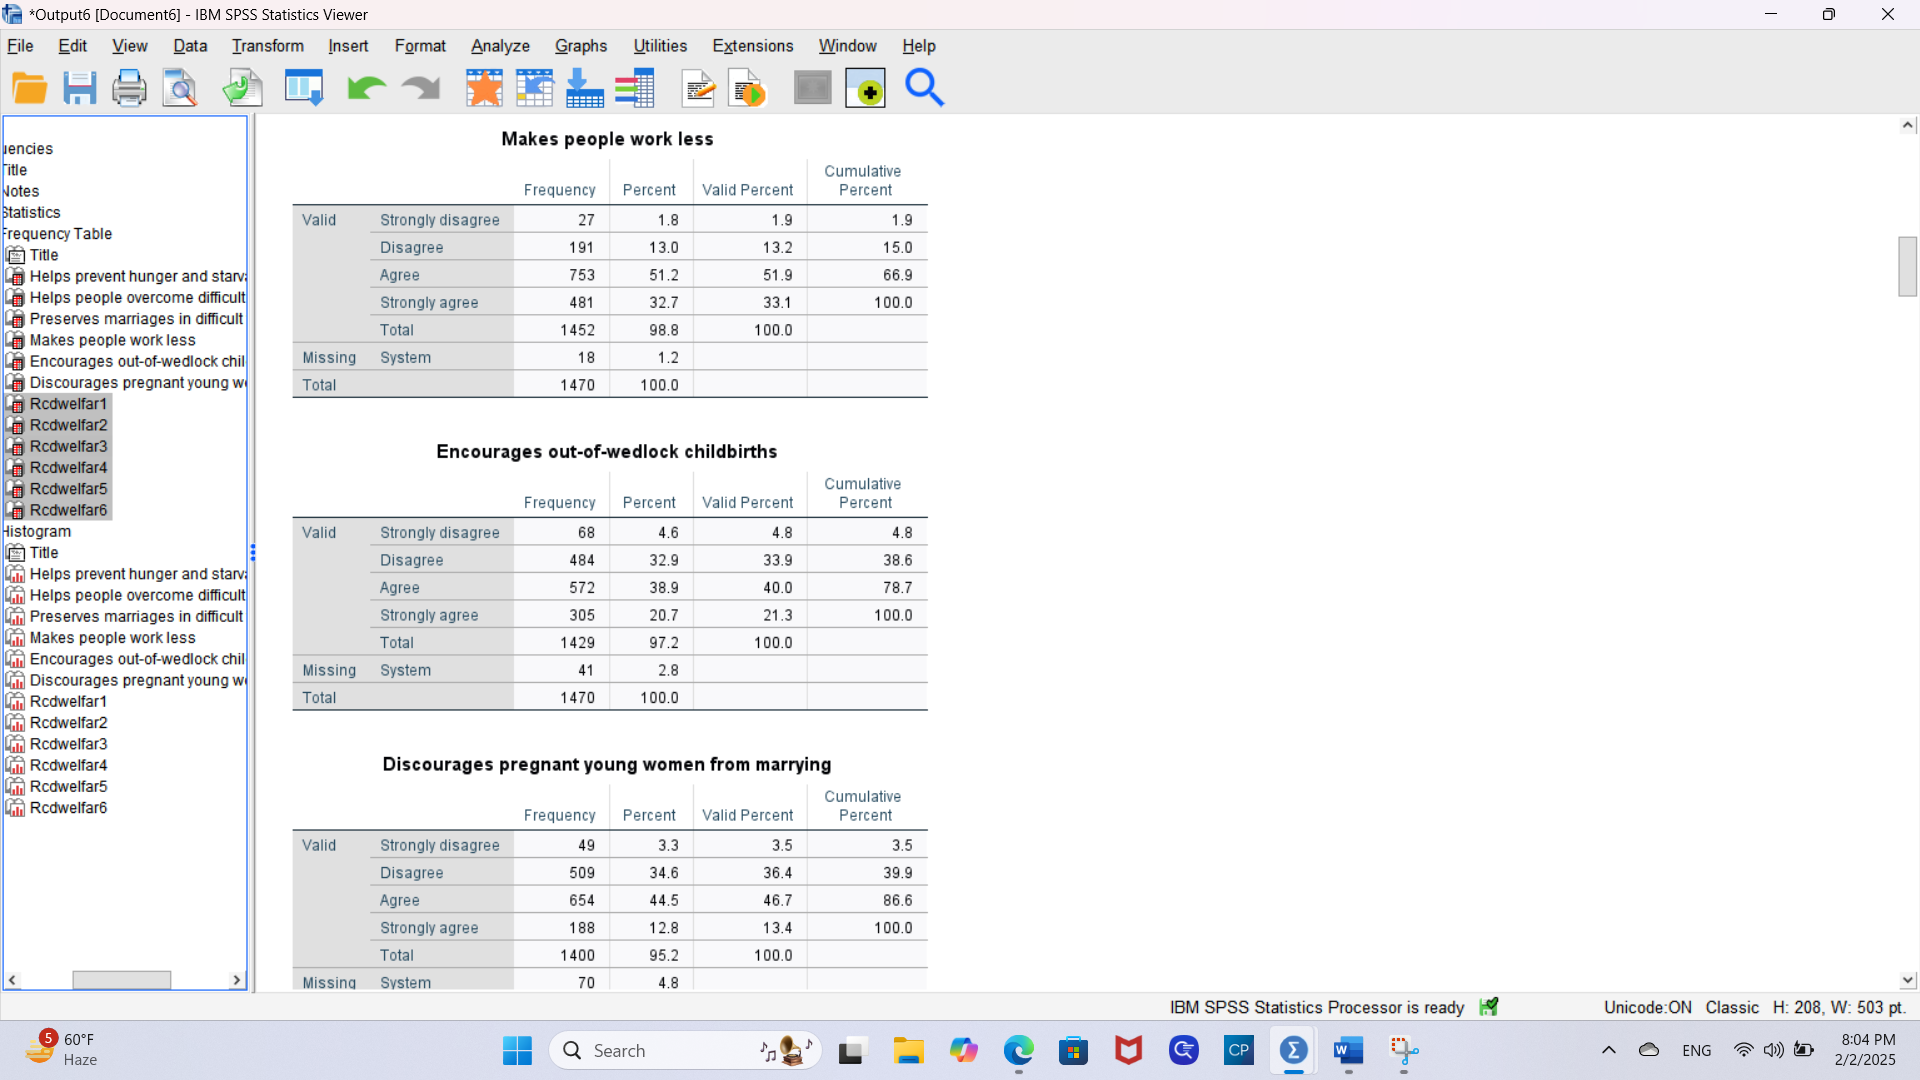
2. Request frequency tables and histograms of the original variables and the newly created ones.
3. Answer the following questions on this sheet of paper (using the original variables for questions 1-5 and the new variables for question 6-8), and submit it at the beginning of lecture on the due date.
Questions
1. What level of measurement do these six variables achieve?
2. For which of the six variables does the highest percentage of respondents strongly agree, & at what percentag?
3. Do similar values on the welfare variables (such as "Strongly Agree) indicate similar sentiments as far as the effects of welfare are concerned (such as "supports welfare")? Why or why not?
4. What is the appropriate measure of central tendency for these variables, and what is the central tendency of each? (Do not just provide a number. You must use the data to summarize the respondents in the sample.)
5. Given your answers to questions 3 and 4, do the respondents tend to support or oppose welfare?
6. For which measure is there the most agreement overall, and at what percentage?
7. For which measure is there the most disagreement overall, and at what percentage?
8. Looking only at those variables where more than 75% of the sample agrees or disagrees, now what can you say about whether the respondents tend to support or oppose welfare - if anything? Be careful to characterize their support or opposition, citing specific data (frequencies, percentages, and/or central tendencies.)
*Output6 [Document6] - IBM SPSS Statistics Viewer X File Edit View Data Transform Insert Format Analyze Graphs Utilities Extensions Window Help + Q Jencies Title Helps people overcome difficult times Notes Cumulative Statistics Frequency Percent Valid Percent Percent Frequency Table Valid Strongly disagree 42 2.9 2.9 2.9 Title Helps prevent hunger and starve Disagree 193 13.1 13.2 16.1 Helps people overcome difficult Agree 1040 70.7 71.3 87.4 Preserves marriages in difficult Strongly agree 183 12.4 2.6 100.0 Makes people work less Encourages out-of-wedlock chill Total 1458 99.2 100.0 Discourages pregnant young w Missing System 12 Rodwelfar1 Total 1470 100.0 Rcdwelfar2 Rodwelfar3 r Rcdwelfar4 Preserves marriages in difficult times Rcdwelfar5 Rodwelfare Cumulative Histogram Frequency Percent Valid Percent Percent Title Valid Strongly disagree 92 6.3 6.5 6.5 Lin Helps prevent hunger and starv Disagree 491 33.4 34.5 41.0 Lam Helps people overcome difficult Preserves marriages in difficult Agree 772 52.5 54.3 95.3 Makes people work less Strongly agree 67 4.6 4.7 100.0 " Encourages out-of-wedlock chill Total 1422 96.7 100.0 L Discourages pregnant young w Gi Rodwelfar1 Missing System 48 3.3 in Rodwelfar2 Total 1470 100.0 Rodwelfar3 Rodwelfar4 Rodwelfar5 Makes people work less Rodwelfare Cumulative Frequency Percent Valid Percent Percent Valid Strongly disagree 27 1.8 1.9 1.9 Disagree 191 13.0 13.2 15.0 Agree 753 51.2 51.9 66.9 Strongly agree 481 32.7 33.1 100.0 Total 1452 98.8 100.0 IBM SPSS Statistics Processor is ready . Unicode:ON Classic H: 208, W: 503 pt. 5 60OF Haze Q Search L CP W ENG () D 8:04 PM 2/2/2025*Output6 [Document6] - IBM SPSS Statistics Viewer X File Edit View Data Transform Insert Format Analyze Graphs Utilities Extensions Window Help + Q Makes people work less Jencies Title Cumulative Notes Frequency Percent Valid Percent Percent Statistics Valid Strongly disagree 27 1.8 1.9 1.9 Frequency Table Title Disagree 191 13.0 13.2 15.0 Helps prevent hunger and starve Agree 753 51.2 51.9 66.9 Helps people overcome difficult Strongly agree 481 32.7 33.1 100.0 Preserves marriages in difficult Total 1452 98.8 100.0 Makes people work less Encourages out-of-wedlock chill Missing System 18 1.2 Discourages pregnant young w Tota 1470 100.0 Rodwelfar1 Rcdwelfar2 Rodwelfar3 Encourages out-of-wedlock childbirths r Rcdwelfar4 Rcdwelfar5 Cumulative Frequency Percent Valid Percent Percent Rodwelfare Histogram Valid Strongly disagree 68 4.6 4.8 4.8 Title Disagree 484 32.9 33.9 38.6 Lin Helps prevent hunger and starv Agree 572 38.9 40.0 78.7 Lam Helps people overcome difficult Preserves marriages in difficult Strongly agree 305 20.7 21.3 100.0 Makes people work less Total 1429 97.2 100.0 " Encourages out-of-wedlock chil Missing System 41 2.8 L Discourages pregnant young w Gi Rodwelfar1 Tota 1470 100.0 in Rodwelfar2 Rodwelfar3 Rodwelfar4 Discourages pregnant young women from marrying Rodwelfar5 Cumulative Rodwelfare Frequency Percent Valid Percent Percent Valid Strongly disagree 49 3.3 3.5 3.5 Disagree 509 34.6 36.4 39.9 Agree 654 14.5 46.7 86.6 Strongly agree 188 12.8 13.4 100.0 Total 1400 95.2 100.0 Missing System 70 4.8 IBM SPSS Statistics Processor is ready . Unicode:ON Classic H: 208, W: 503 pt. 5 60OF Q Search CP W ENG () D 8:04 PM Haze 2/2/2025*Output6 [Document6] - IBM SPSS Statistics Viewer X File Edit View Data Transform Insert Format Analyze Graphs Utilities Extensions Window Help + Jencies Title Rcdwelfar1 Notes Statistics Cumulative Frequency Percent Valid Percent Frequency Table Percent Title Valid Strongly Agree 162 11.0 11.1 11.1 Helps prevent hunger and starve Agree 228 15.5 15.6 26.7 Helps people overcome difficult Neutral 1070 72.8 73.3 Preserves marriages in difficult 100.0 Makes people work less Total 1460 99.3 100.0 Encourages out-of-wedlock chill Missing System 10 Discourages pregnant young w Total 1470 100.0 Rodwelfar1 Rcdwelfar2 Rodwelfar3 r Rcdwelfar4 Redwelfar2 Rcdwelfar5 Cumulative Rodwelfare Frequency Percent Valid Percent Percent Histogram Valid Strongly Agree 235 16.0 16.1 16.1 Title Lin Helps prevent hunger and starv Agree 183 12.4 12.6 28.7 Lam Helps people overcome difficult Neutral 1040 70.7 71.3 100.0 Preserves marriages in difficult Total 1458 99.2 100.0 Makes people work less Encourages out-of-wedlock chil Missing System 12 L Discourages pregnant young w Total 1470 100.0 Gi Rodwelfar1 in Rodwelfar2 Rodwelfar3 Redwelfar3 Rodwelfar4 Cumulative Rodwelfar5 Frequency Percent Valid Percent Percent Rodwelfar6 Valid Strongly Agree 583 39.7 41.0 41.0 Agree 67 4.6 4.7 45.7 Neutral 772 52.5 54.3 100.0 Total 1422 96.7 100.0 Missing System 48 3.3 Total 1470 100.0 IBM SPSS Statistics Processor is ready . Unicode:ON Classic H: 208, W: 503 pt. 5 60OF Q Search CP W ENG () D 8:04 PM Haze 2/2/2025*Output6 [Document6] - IBM SPSS Statistics Viewer X File Edit View Data Transform Insert Format Analyze Graphs Utilities Extensions Window Help Q Jencies Title Redwelfar4 Notes Cumulative Statistics Frequency Percent Valid Percent Percent Frequency Table Valid Strongly Agree 218 14.8 15.0 15.0 Title Helps prevent hunger and starve Agree 481 32.7 33.1 48.1 Helps people overcome difficult Neutral 753 51.2 51.9 100.0 Preserves marriages in difficult Total 1452 98.8 100.0 Makes people work less Encourages out-of-wedlock chil Missing System 18 1.2 Discourages pregnant young w Tota 1470 100.0 Rodwelfar1 Rcdwelfar2 Rodwelfar3 Rcdwelfar5 r Rcdwelfar4 Rcdwelfar5 Cumulative Percent Percent Rodwelfare Frequency Valid Percent Histogram Valid Strongly Agree 552 37.6 38.6 38.6 Title Agree 305 20.7 21.3 60.0 Lin Helps prevent hunger and starv Neutral 572 38.9 40.0 100.0 Lam Helps people overcome difficult Preserves marriages in difficult Total 1429 97.2 100.0 Makes people work less Missing System 41 2.8 Encourages out-of-wedlock chil Total 1470 100.0 L Discourages pregnant young w Gi Rodwelfar1 in Rodwelfar2 Rodwelfar3 Redwelfar6 Rodwelfar4 Cumulative Rodwelfar5 Frequency Percent Valid Percent Percent Rodwelfar6 Valid Strongly Agree 558 38.0 39.9 39.9 Agree 188 12.8 13.4 53.3 Neutral 654 44.5 46.7 100.0 Total 1400 95.2 100.0 Missing System 70 4.8 Total 1470 100.0 IBM SPSS Statistics Processor is ready . Unicode:ON Classic H: 208, W: 503 pt. 5 60OF 8:04 PM Q Search CP W ENG () D 2/2/2025 HazeStatistics Encourages Discourages Helps prevent Helps people Preserves out-of- pregnant hunger and overcome marriages in Makes people wedlock young women starvation difficult times difficult times work less childbirths from marrying Redwelfar1 Rcdwelfar2 Redwelfar3 Rcdwelfar4 Redwelfar5 Redwelfar6 N Valid 1460 1458 1422 1452 1429 1400 1460 1458 1422 1452 1429 1400 Missing 10 12 48 18 41 70 10 12 48 18 41 70 Mean 3.03 2.94 2.57 3.16 2.78 2.70 2.62 2.55 2.13 2.37 2.01 2.0686 Median 3.00 3.00 3.00 3.00 3.00 3.00 3.00 3.00 3.00 3.00 2.00 2.0000 Mode 3 3 3 3 3 3 3 3 3 3 3 3.00 Std. Deviation .566 608 685 715 833 741 676 .755 967 730 887 92824 Range 3 3 3 3 3 3 2 2 2 2 2 2.00 Percentiles 25 3.00 3.00 2.00 3.00 2.00 2.00 2.00 2.00 1.00 2.00 1.00 1.0000 50 3.00 3.00 3.00 3.00 3.00 3.00 3.00 3.00 3.00 3.00 2.00 2.0000 75 3.00 3.00 3.00 4.00 3.00 3.00 3.00 3.00 3.00 3.00 3.00 3.0000 Frequency Table Helps prevent hunger and starvation Cumulative Frequency Percent Valid Percent Percent Valid Strongly disagree 26 1.8 1.8 1.8 Disagree 136 9.3 9.3 11.1 Agree 1070 72.8 73.3 84.4 Strongly agree 228 15.5 15.6 100.0 Total 1460 99.3 100.0 Missing System 10 .7 Total 1470 100.0