

Question: SSU Moodle Home Page Using the table below, interpret all key regression results. Not yet answered Points out of 3.00 SUMMARY OUTPUT Flag question Finish
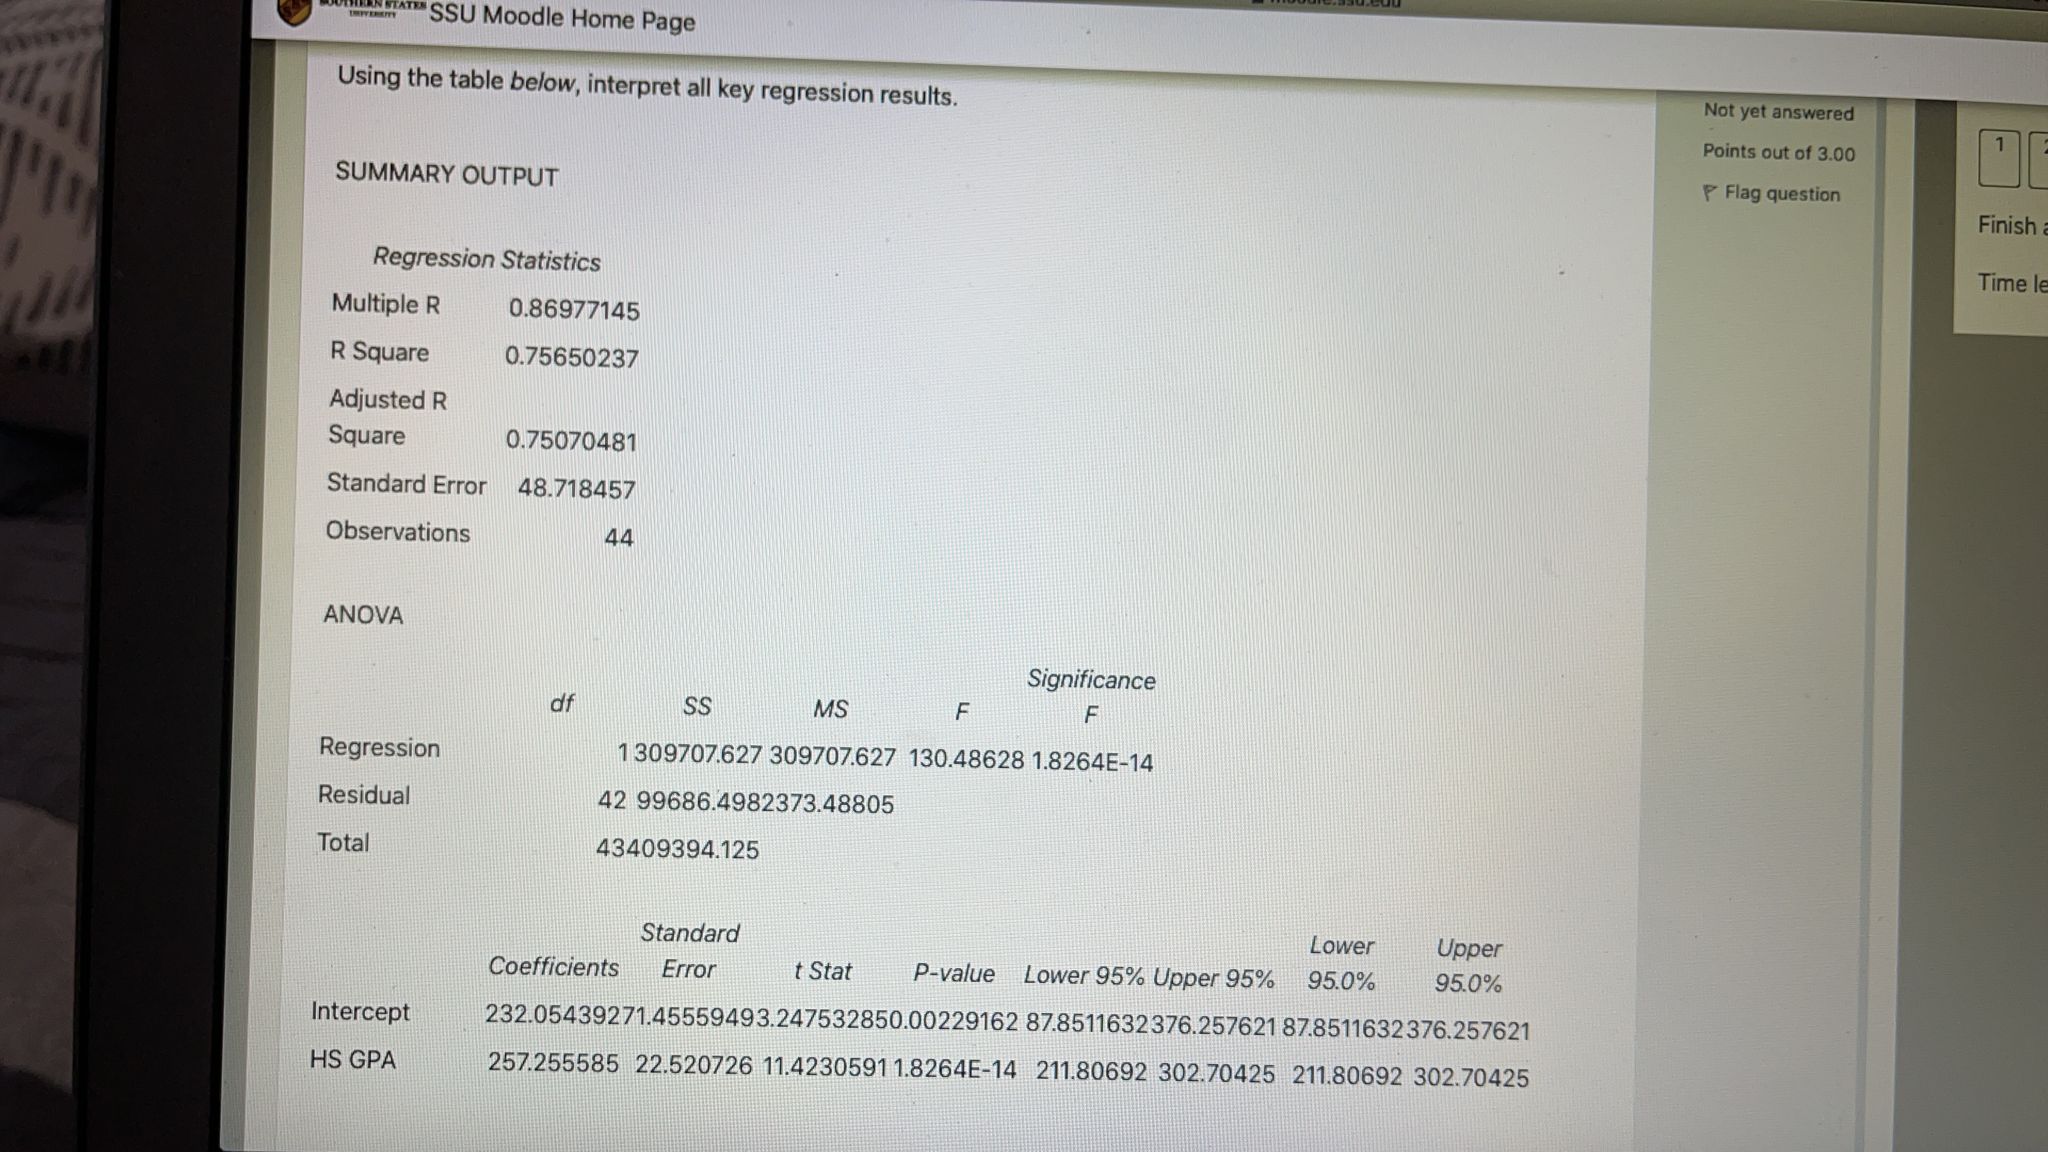
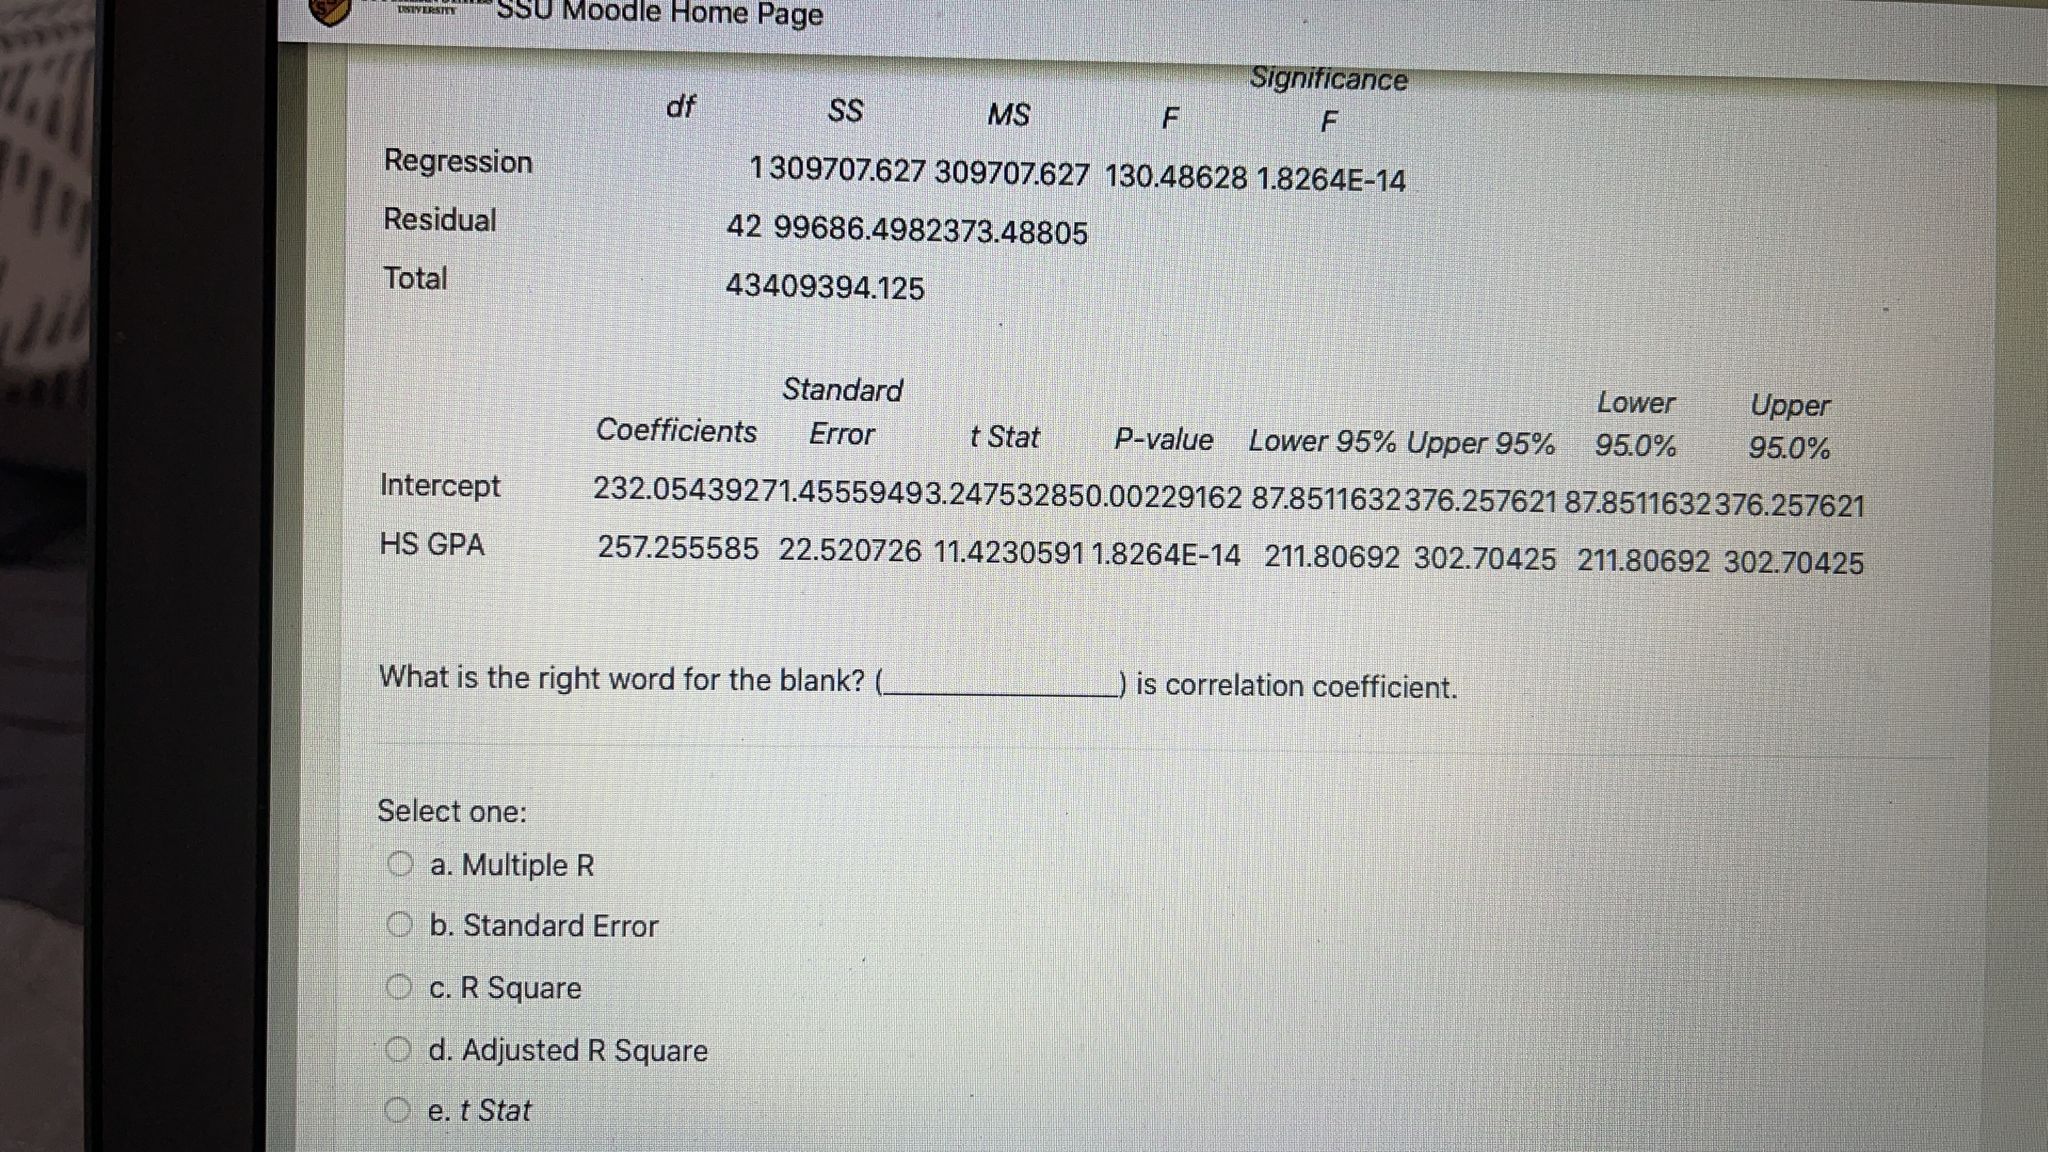
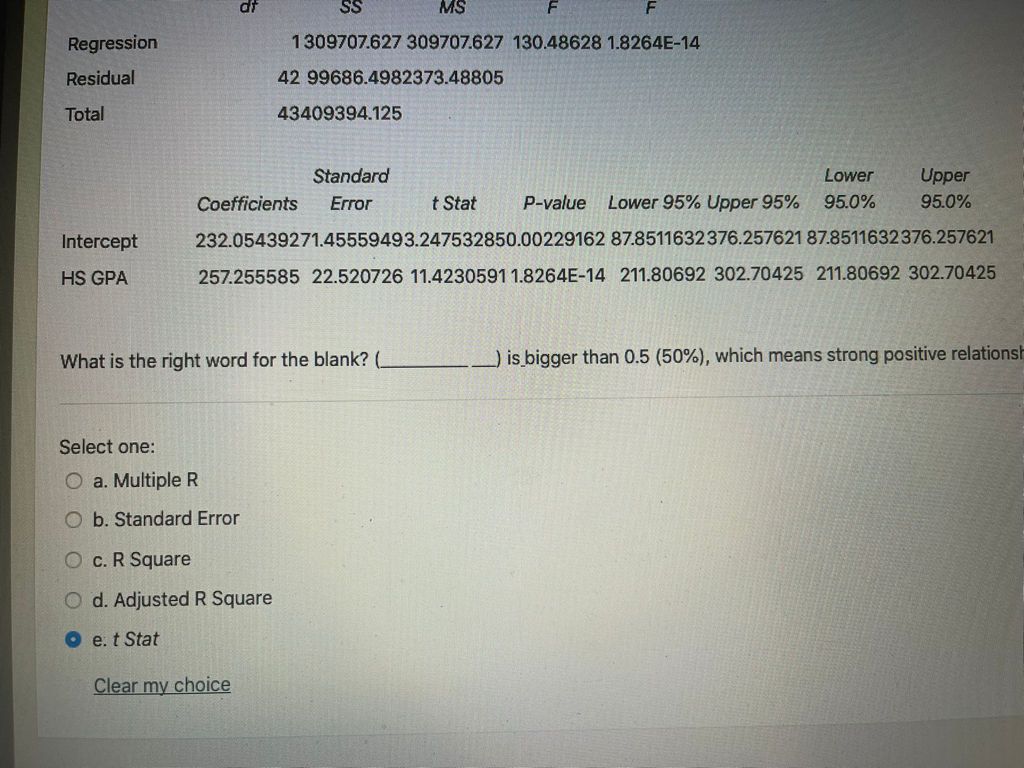
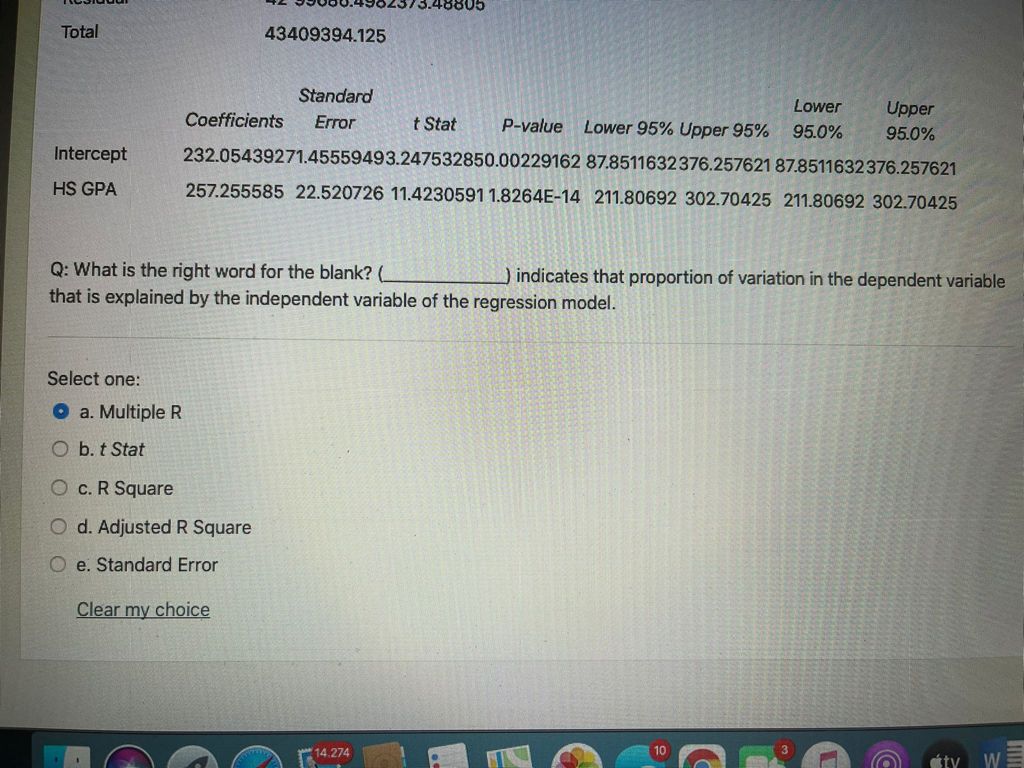
"SSU Moodle Home Page Using the table below, interpret all key regression results. Not yet answered Points out of 3.00 SUMMARY OUTPUT Flag question Finish Regression Statistics Time le Multiple R 0.86977145 R Square 0.75650237 Adjusted R Square 0.75070481 Standard Error 48.718457 Observations 44 ANOVA Significance df SS MS F F Regression 1 309707.627 309707.627 130.48628 1.8264E-14 Residual 42 99686.4982373.48805 Total 43409394.125 Standard Lower Upper Coefficients Error t Stat P-value Lower 95% Upper 95% 95.0% 95.0% Intercept 232.05439271.45559493.247532850.00229162 87.8511632376.257621 87.8511632376.257621 HS GPA 257.255585 22.520726 11.4230591 1.8264E-14 211.80692 302.70425 211.80692 302.70425SSU Moodle Home Page Significance of SS MS F F Regression 1 309707.627 309707.627 130.48628 1.8264E-14 Residual 42 99686.4982373.48805 Total 43409394.125 Standard Lower Upper Coefficients Error t Stat P-value Lower 95% Upper 95% 95.0% 95.0% Intercept 232.05439271.45559493.247532850.00229162 87.8511632376.257621 87.8511632376.257621 HS GPA 257.255585 22.520726 11.4230591 1.8264E-14 211.80692 302.70425 211.80692 302.70425 What is the right word for the blank? ( )is correlation coefficient. Select one: O a. Multiple R O b. Standard Error O c. R Square O d. Adjusted R Square O e. t StatSS MS F Regression 1309707.627 309707.627 130.48628 1.8264E-14 Residual 42 99686.4982373.48805 Total 43409394.125 Standard Lower Upper Coefficients Error t Stat P-value Lower 95% Upper 95% 95.0% 95.0% Intercept 232.05439271.45559493.247532850.00229162 87.8511632376.257621 87.8511632376.257621 HS GPA 257.255585 22.520726 11.4230591 1.8264E-14 211.80692 302.70425 211.80692 302.70425 What is the right word for the blank? ( _) is bigger than 0.5 (50%), which means strong positive relations Select one: O a. Multiple R O b. Standard Error O c. R Square O d. Adjusted R Square O e. t Stat Clear my choice29/3.48605 Total 43409394.125 Standard Lower Upper Coefficients Error t Stat P-value Lower 95% Upper 95% 95.0% 95.0% Intercept 232.05439271.45559493.247532850.00229162 87.8511632376.257621 87.8511632376.257621 HS GPA 257.255585 22.520726 11.4230591 1.8264E-14 211.80692 302.70425 211.80692 302.70425 Q: What is the right word for the blank? (_ ) indicates that proportion of variation in the dependent variable that is explained by the independent variable of the regression model. Select one: a. Multiple R O b. t Stat O c. R Square O d. Adjusted R Square O e. Standard Error Clear my choice 14.274 10 3 WE
Step by Step Solution
There are 3 Steps involved in it

Get step-by-step solutions from verified subject matter experts