

Question: Sta Click here to view the discrete distributions. Implement a financial simulation model for a new product proposal and determine a distribution of profits using
Sta
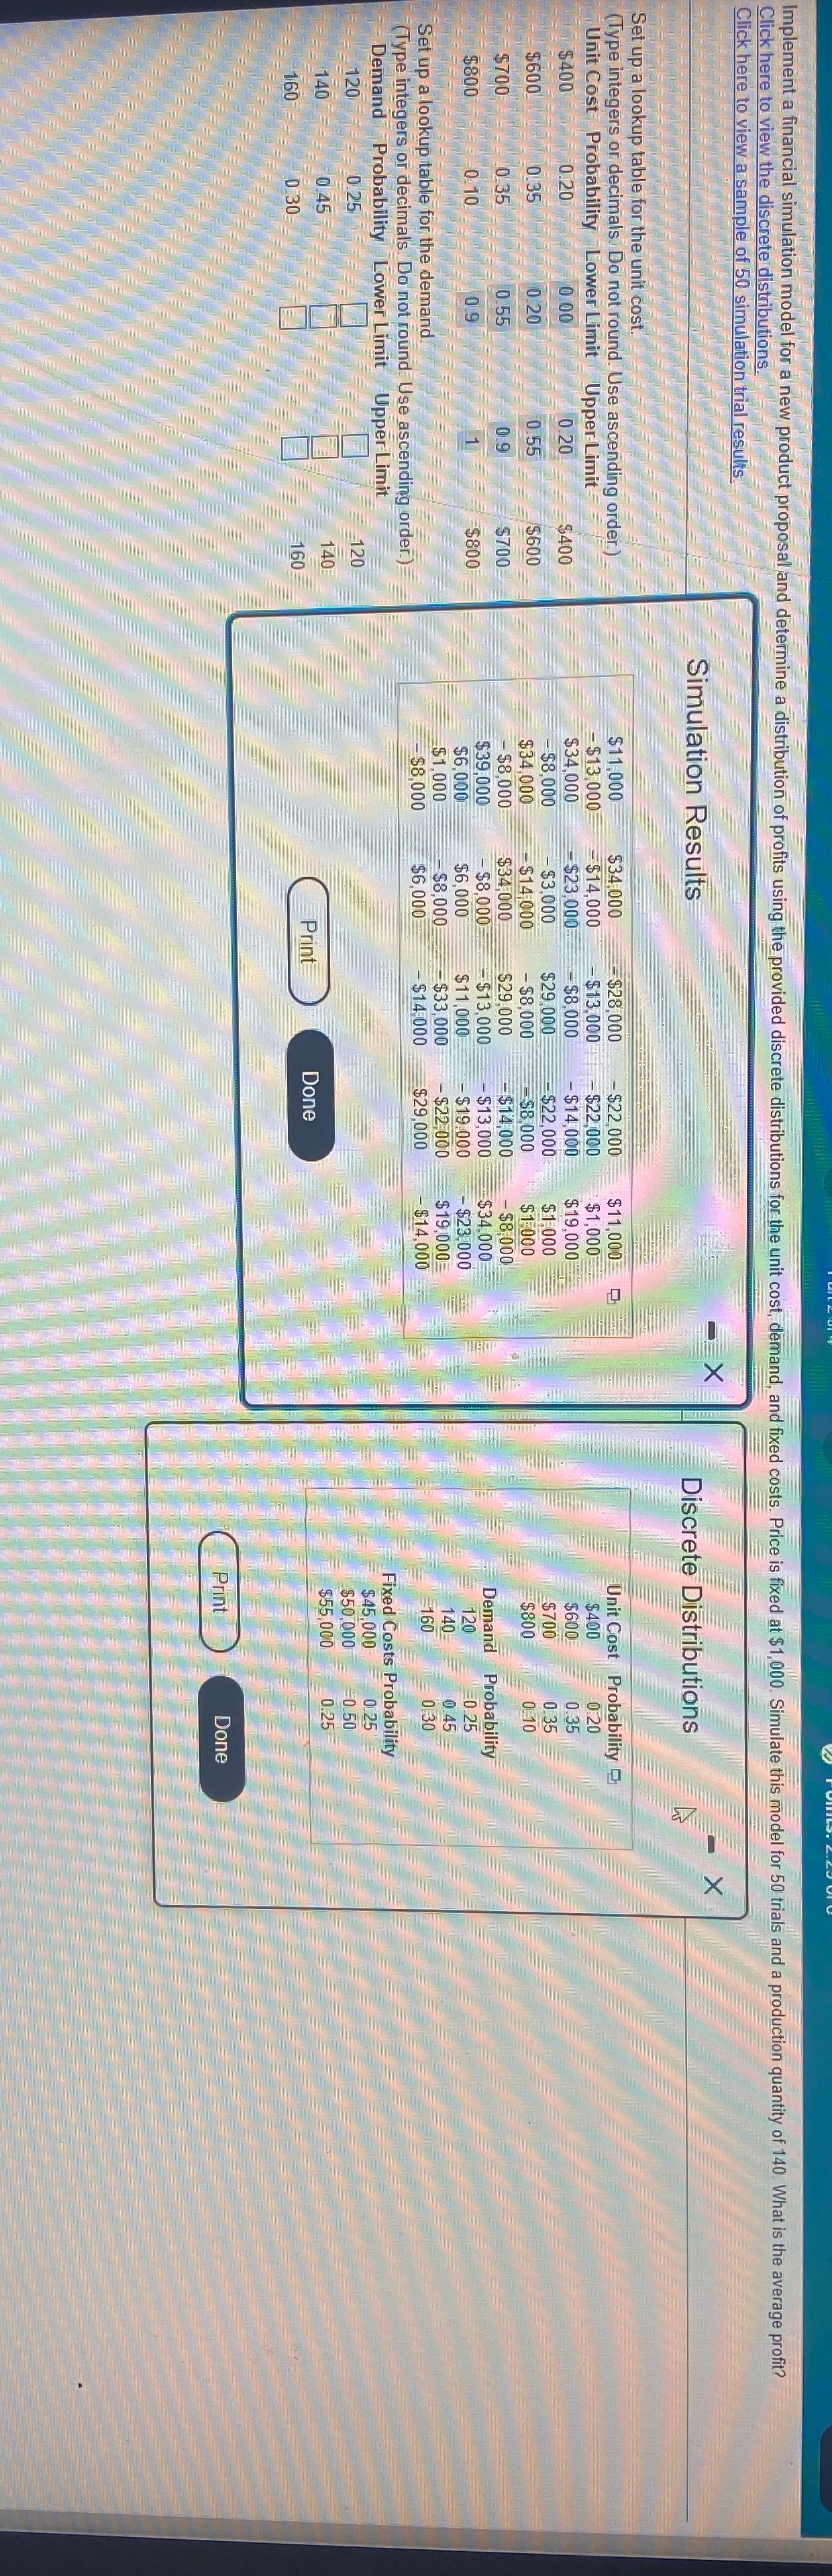
Click here to view the discrete distributions. Implement a financial simulation model for a new product proposal and determine a distribution of profits using the provided discrete distributions for the unit cost, demand, and fixed costs. Price is fixed at $1,000. Simulate this model for 50 trials and a production quantity of 140. What is the average profit? Click here to view a sample of 50 simulation trial results Simulation Results Discrete Distributions Set up a lookup table for the unit cost. (Type integers or decimals. Do not round. Use ascending order.) $11,000 $34.000 - $28 000 - $22 000 $11,000 Unit Cost Probability Unit Cost Probability Lower Limit Upper Limit - $13.000 $14,000 -$13.000 - $22.000 $1.000 $400 0:20 $400 0.20 0.00 0.20 $400 $34.000 $23,000 - $8,000 $14,000 $19,000 $600 0.35 $600 0.35 0.20 0.55 - $8.000 $600 $3,000 $29.000 $22,000 $1,000 $700 0.35 $34.000 $14 000 - $8.000 - $8.000 $1,000 $800 0.10 $700 0.35 0.55 $700 - $8.000 $34.000 $29,000 -$14 000 -$8,000 $800 0 10 0.9 $800 $39 000 - $8.000 - $13,000 $13.000 $34.000 Demand Probability $6.000 56.000 $11.000 $19 000 - $23.000 120 0.25 Set up a lookup table for the demand. $1.000 - $8.000 - $33.000 -$22 000 $19,000 140 0.45 - $8,000 $6,000 $14,000 $29.000 -$14,000 160 0. 30 (Type integers or decimals. Do not round. Use ascending order.) Demand Probability Lower Limit Upper Limit Fixed Costs Probability 120 0.25 120 $45.000 0.25 $50,000 0 50 140 0 45 140 $55.000 0.25 160 0.30 160 Print Done Print Done
Step by Step Solution
There are 3 Steps involved in it

Get step-by-step solutions from verified subject matter experts