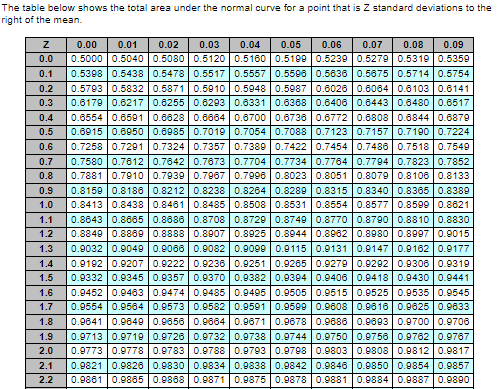
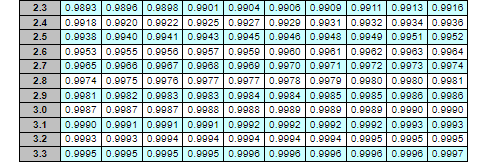
Question: Standard normal table: In a Q system, the demand rate for strawberry ice cream is normally distributed, with an average of 305 pints per week.

Standard normal table: In a Q system, the demandStandard normal table:

Standard normal table: In a Q system, the demand

Standard normal table: In a Q system, the demand

Standard normal table: In a Q system, the demand

In a Q system, the demand rate for strawberry ice cream is normally distributed, with an average of 305 pints per week. The lead time is 6 weeks. The standard deviation of weekly demand is 16 pints. Refer to the standard normal table for z-values The table below shows the total area under the normal curve for a point that is Z standard deviations to the right of the mean. 0.04 Z 0.0 0.1 0.2 0.3 0.4 0.5 0.6 0.7 0.8 0.9 1.0 1.1 1.2 1.3 1.4 1.5 1.6 1.7 1.8 1.9 2.0 2.1 2.2 0.00 0.01 0.02 0.03 0.05 0.06 0.07 0.08 0.09 0.5000 0.5040 0.5080 0.5120 0.51600.5199 0.5239 0.52790.5319 0.5359 0.5398 0.5438 0.5478 0.5517 0.5557 0.5598 0.5636 0.5875 0.5714 0.5754 0.5793 0.58320.58710.5910 0.5948 0.5987 0.6026 0.8064 0.8103 0.6141 0.61790.62170.6255 0.6293 0.6331 0.6368 0.6406 0.6443 0.8480 0.6517 0.65540.6591 0.6628 0.68640.6700 0.6736 0.6772 0.6808 0.68440.6879 0.6915 0.6950 0.6985 0.7019 0.7054 0.7088 0.7123 0.7157 0.7190 0.7224 0.7258 0.7291 0.7324 0.7357 0.7389 0.7422 0.7454 0.7486 0.75180.7549 0.7580 0.7612 0.76420.7673 0.7704 0.77340.7764 0.77940.7823 0.7852 0.7881 0.7910 0.7939 0.7967 0.7996 0.8023 0.8051 0.8079 0.8106 0.8133 0.8159 0.8186 0.8212 0.8238 0.8264 0.8289 0.8315 0.8340 0.8365 0.8389 0.8413 0.8438 0.8481 0.8485 0.8508 0.8531 0.85540.85770.8599 0.8621 0.86430.8665 0.8686 0.8708 0.8729 0.8749 0.8770 0.8790 0.8810 0.8830 0.8849 0.8869 0.8888 0.8907 0.8925 0.8944 0.89620.89800.8997 0.9015 0.9032 0.9049 0.9066 0.9082 0.9099 0.9115 0.9131 0.9147 0.9162 0.9177 0.91920.9207 0.9222 0.9236 0.9251 0.9265 0.9279 0.9292 0.9306 0.9319 0.9332 0.9345 0.9357 0.9370 0.93820.9394 0.9406 0.9418 0.9430 0.9441 0.94520.9463 0.9474 0.9485 0.9495 0.9505 0.9515 0.9525 0.9535 0.9545 0.9554 0.9584 0.9573 0.9582 0.9591 0.9599 0.9808 0.9816 0.9625 0.9833 0.9641 0.9649 0.9656 0.98640.9671 0.9678 0.9886 0.9893 0.9700 0.9706 0.9713 0.9719 0.9726 0.9732 0.9738 0.9744 0.9750 0.97560.97620.9767 0.97730.9778 0.97830.97880.9793 0.9798 0.98030.9808 0.98120.9817 0.9821 0.9826 0.9830 0.9834 0.9838 0.98420.9846 0.9850 0.98540.9857 0.9861 0.9885 0.9868 0.98710.9875 0.9878 0.98810.9884 0.9887 0.9890 ITT 2.3 2.4 2.5 2.6 2.7 2.8 2.9 3.0 3.1 3.2 3.3 0.9893 0.9896 0.9898 0.9901 0.99040.9906 0.9909 0.99110.99130.9916 0.9918 0.9920 0.9922 0.9925 0.9927 0.9929 0.9931 0.99320.9934 0.9936 0.9938 0.9940 0.9941 0.9943 0.9945 0.9946 0.9948 0.9949 0.9951 0.9952 0.9953 0.9955 0.9956 0.9957 0.99590.9960 0.9961 0.99620.9963 0.9984 0.9965 0.9966 0.9967 0.9968 0.9969 0.9970 0.9971 0.9972 0.9973 0.9974 0.99740.9975 0.9978 0.9977 0.9977 0.9978 0.9979 0.99800.99800.9981 0.9981 0.99820.9983 0.9983 0.99840.9984 0.9985 0.9985 0.9986 0.9986 0.9987 0.9987 0.9987 0.9988 0.9988 0.9989 0.9989 0.9989 0.9990 0.9990 0.9990 0.9991 0.9991 0.9991 0.9992 0.99920.9992 0.99920.9993 0.9993 0.9993 0.9993 0.99940.99940.99940.9994 0.99940.9995 0.9995 0.9995 0.9995 0.9995 0.9995 0.9995 0.9998 0.9998 0.9996 0.9996 0.9996 0.9997 a. The standard deviation of demand during the 6-week lead time is 39 pints. (Enter your response rounded to the nearest whole number.) b. The average demand during the B-week lead time is 1830 pints. (Enter your response as an integer.) c. The reorder point that results in a cycle-service level of 92 percent is pints. (Enter your response rounded to the nearest whole number.)

Step by Step Solution

There are 3 Steps involved in it

1 Expert Approved Answer
Step: 1 Unlock blur-text-image
Question Has Been Solved by an Expert!

Get step-by-step solutions from verified subject matter experts

Step: 2 Unlock
Step: 3 Unlock

Students Have Also Explored These Related General Management Questions!