

Question: Standard Normal Table (Page 1) NEGATIVE 2 Scores Standard Normal (2) Distribution: Cumulative Area from the LEFT 3.50 and lower 3 4 ~13 $ 2
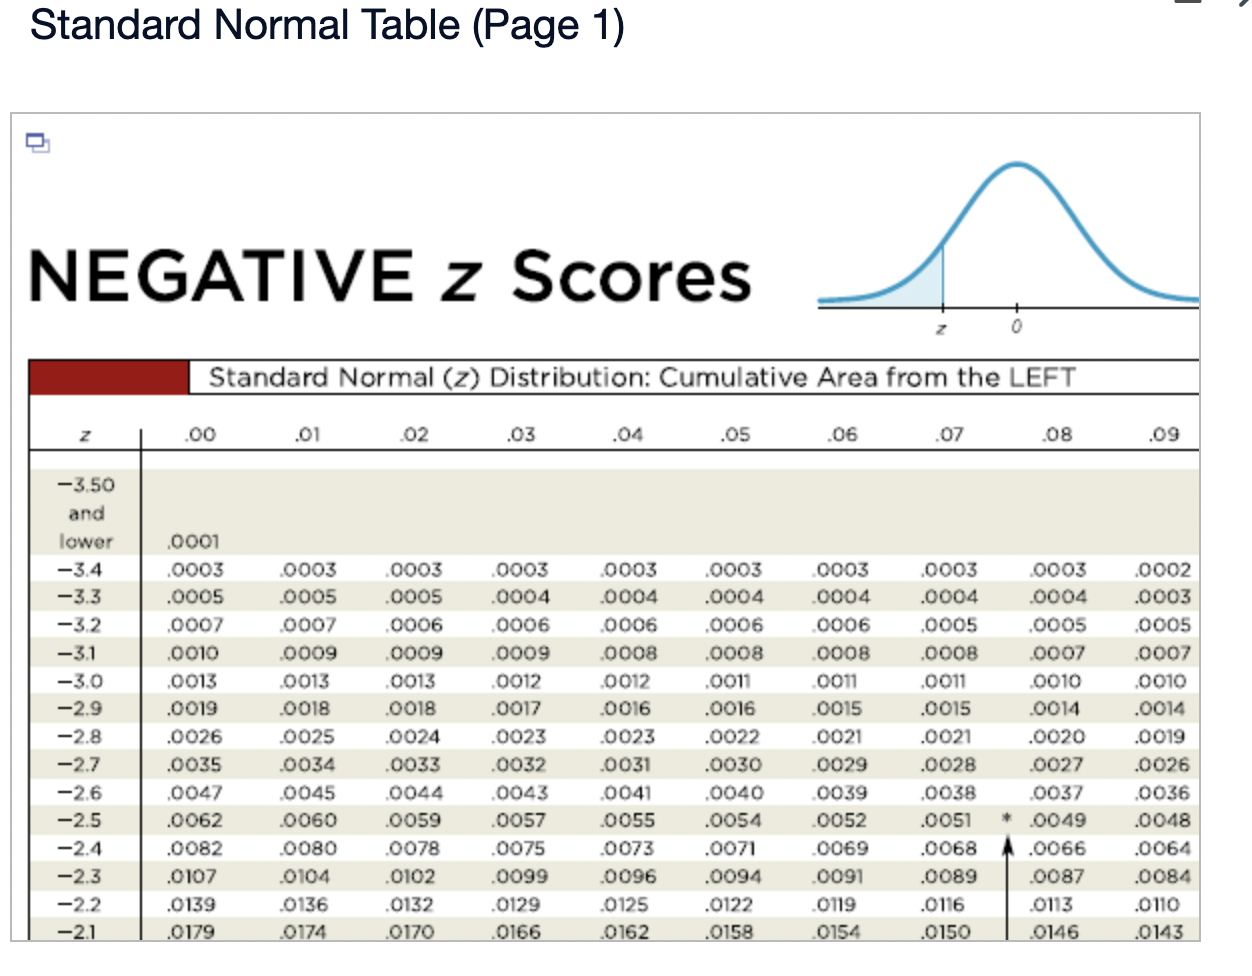

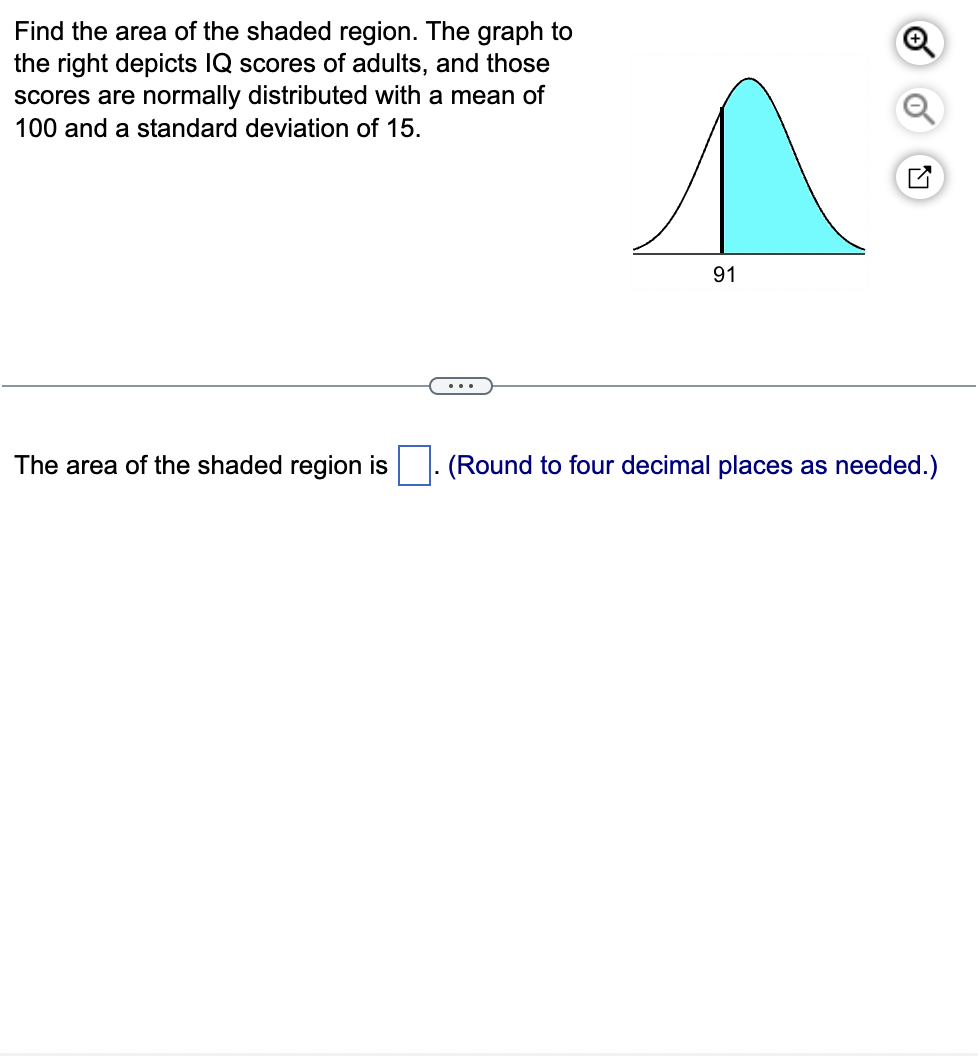


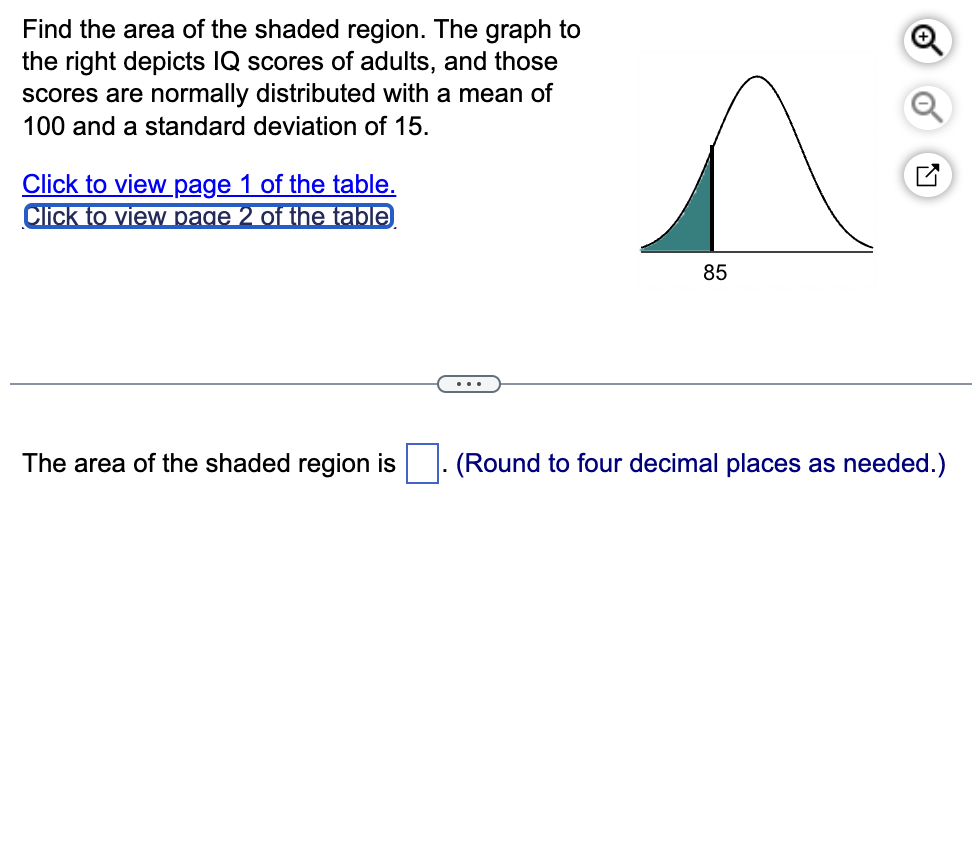

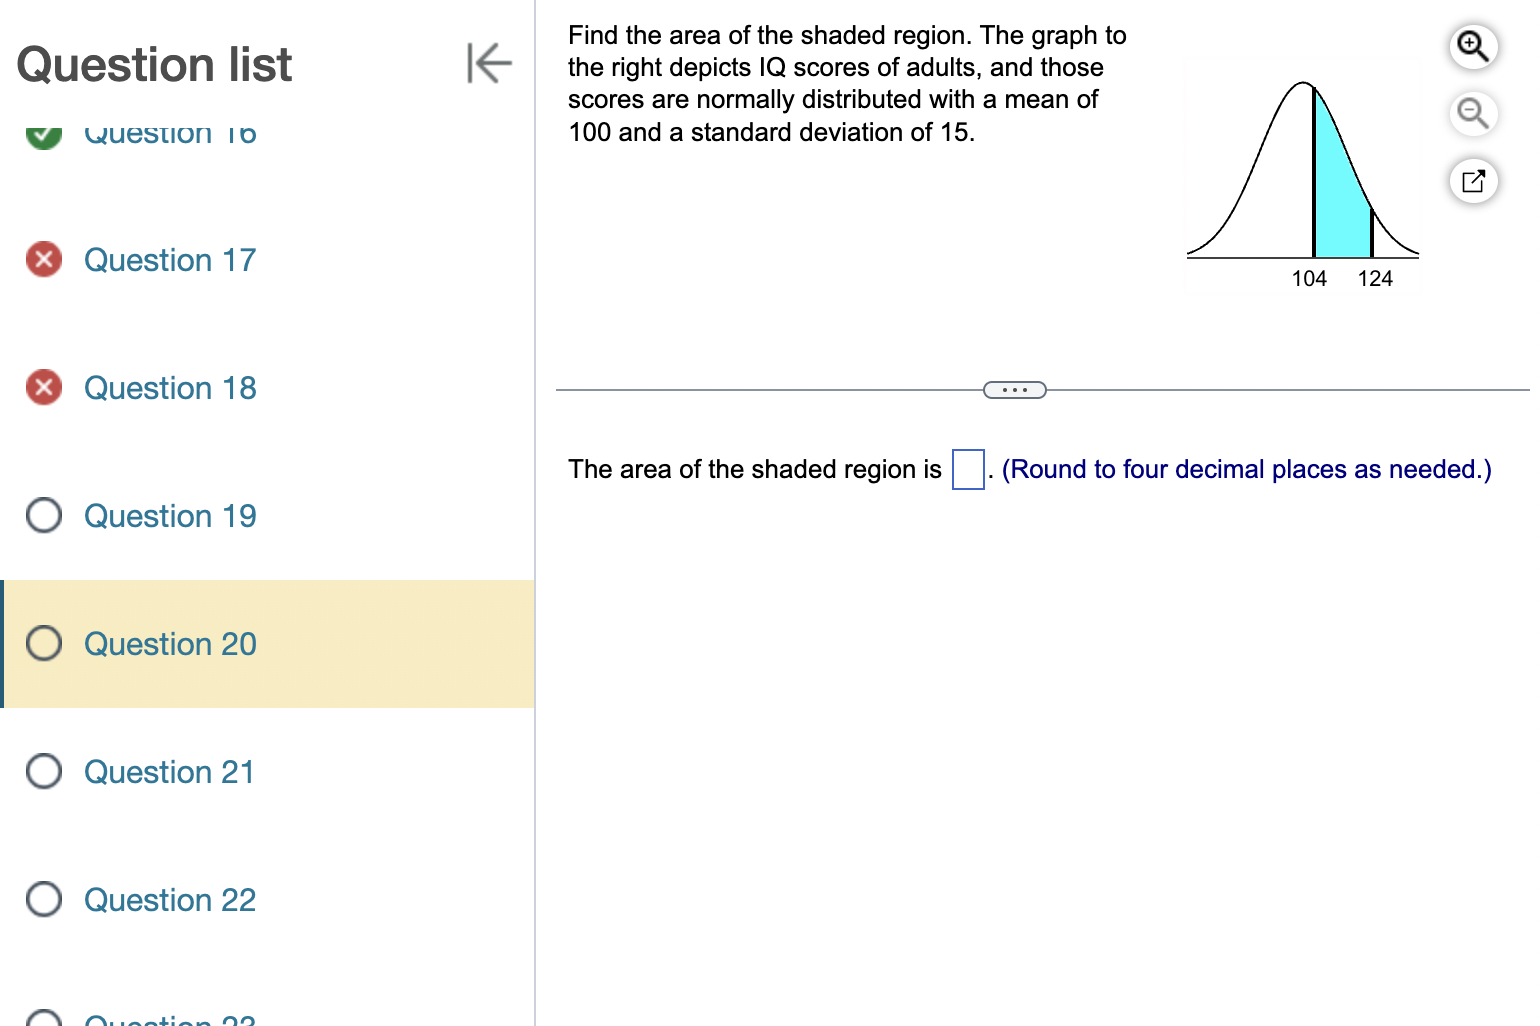
Standard Normal Table (Page 1) NEGATIVE 2 Scores Standard Normal (2) Distribution: Cumulative Area from the LEFT \"3.50 and lower 3 4 ~13 $ 2 \"3.1 3 D \"2.9 ?.8 ~21 2 6 ~25 2.4 ~23 ?.? ~21 .00 .0001 .0003 .0005 .000} .0010 .0013 .0019 .0096 .0035 0011'\"!r .0062 .0082 .0107 .0139 .0179 .01 0003 .0005 000} .0009 0013 .0018 .0095 .0034 0045 .0060 .0080 .0104 .0136 .0174 02 0003 .0005 0006 .0009 0013 .0018 .00?4 .0033 0044 .0059 .0078 .0102 .013? .0170 .03 0003 .0004 0006 .0009 001? .0017 .0093 .0032 00:9.5 .0057 .0075 .0099 .0139 .0166 .04 0003 .0004 0006 .0003 .0 01? .0016 .0 023 .0031 0041 .0055 .0 073 .0096 .0195 .0162 .06 .0003 .0004 .0006 .0003 .0011 .0016 .009? .0030 .0040 .0054 .0071 .0094 .012? .0158 .06 0003 .0004 0006 0003 0011 .0015 00:11 .0029 0059 0052 0069 .0091 0119 .0154 2' .07 .0003 .0004 .0005 .0003 .0011 .0015 .0091 .0023 .0038 .0051 .0068 .0089 .0116 .0150 C. .08 0003 .0004 .0005 .0007 0010 .0014 .009 0 .00? 7 00.52 .0049 .0066 .0037 .0113 .0146 .09 ,0 002 .0003 .0005 .0007 .0 010 .0014 .0 019 .0026 .0 0.56 .0048 .0 064 .0084 .0110 .0143 \fFind the area of the shaded region. The graph to + the right depicts IQ scores of adults, and those scores are normally distributed with a mean of 100 and a standard deviation of 15. Click to view page 1 of the table. Click to view page 2 of the table 85 . . . The area of the shaded region is (Round to four decimal places as needed.)Find the area of the shaded region. The graph to the right depicts IQ scores of adults, and those scores are normally distributed with a mean of 100 and a standard deviation of 15. /{:D 19 91 (E The area of the shaded region is D. (Round to four decimal places as needed.) Find the area of the shaded region. The graph to Question list K the right depicts IQ scores of adults, and those scores are normally distributed with a mean of Question 10 100 and a standard deviation of 15. X Question 17 124 X Question 18 . . . The area of the shaded region is . (Round to four decimal places as needed.) O Question 19 O Question 20 O Question 21 O Question 22
Step by Step Solution
There are 3 Steps involved in it

Get step-by-step solutions from verified subject matter experts