

Question: Standard Normal Table (Page 2) .OT 07 .04 .05 .07 .OH .09 0.0 5000 .5040 .5080 .5120 .5160 .5199 5239 .5279 5319 .5359 0.1 .5398
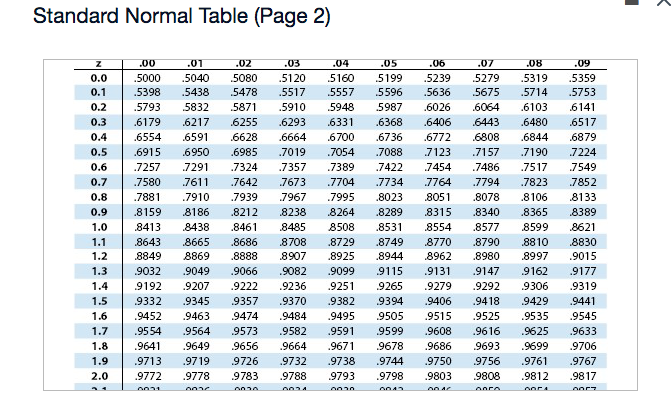
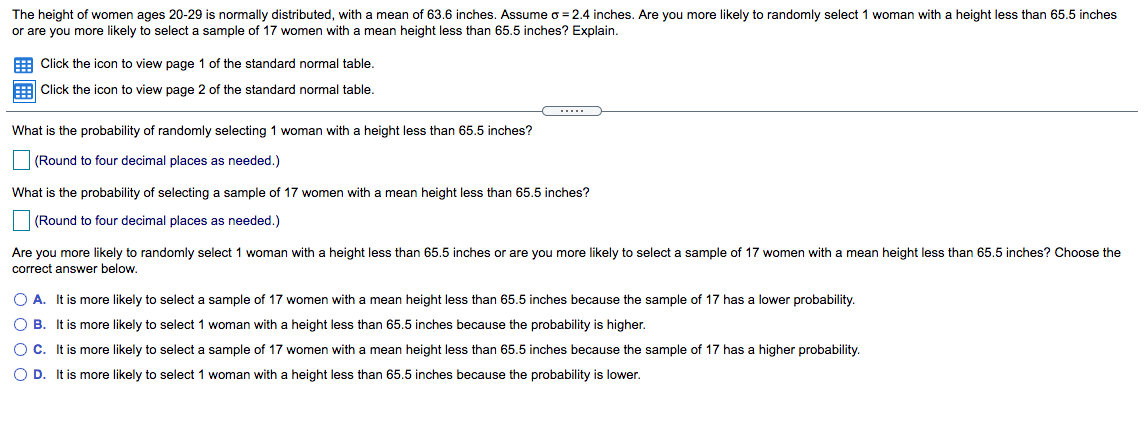
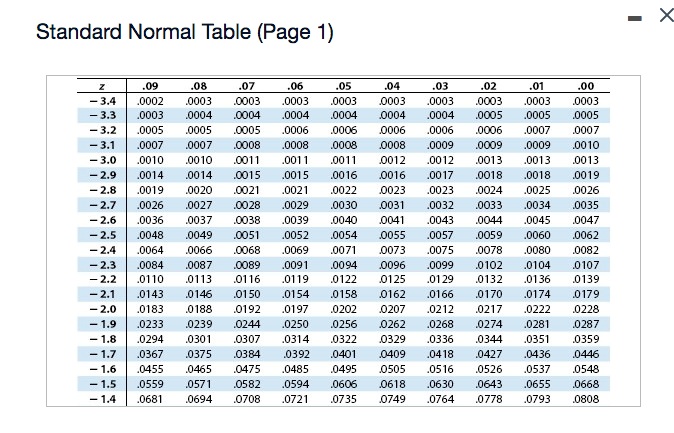
Standard Normal Table (Page 2) .OT 07 .04 .05 .07 .OH .09 0.0 5000 .5040 .5080 .5120 .5160 .5199 5239 .5279 5319 .5359 0.1 .5398 .5438 .5478 .5517 5557 .5596 .5636 .5675 .5714 .5753 0.2 .5793 5832 5871 .5910 .5948 5987 .6026 .6064 .6103 6141 0.3 .6179 .6217 .6255 .6293 .6331 .6368 .6406 .6443 .6480 .6517 0.4 .6554 .6591 .6628 .6664 .6700 .6736 .6772 .6808 .6844 .6879 0.5 .6915 .6950 .6985 .7019 .7054 .7088 .7123 .7157 .7190 7224 0.6 .7257 7291 .7324 .7357 .7389 .7422 7454 .7486 .7517 7549 0.7 .7580 7611 .7642 7673 .7704 .7734 7764 .7794 .7823 7852 0.8 .7881 7910 .7939 7967 .7995 .8023 .8051 .8078 .8106 .8133 0.9 .8159 .8186 .8212 .8238 .8264 .8289 8315 .8340 .8365 .8389 1.0 .8413 .8438 .8461 .8485 8508 .8531 .8554 8577 8599 .8621 1.1 .8643 8665 .8686 8708 .8729 .8749 .8770 .8790 .8810 .8830 1.2 .8849 8869 .8888 8907 .8925 .8944 .8962 .8980 .8997 .9015 1.3 .9032 .9049 .9066 .9082 .9099 9115 .9131 .9147 9162 .9177 1.4 9192 .9207 .9222 .9236 .9251 .9265 .9279 .9292 .9306 .9319 1.5 9332 .9345 9357 .9370 .9382 9394 .9406 .9418 .9429 .9441 1.6 .9452 .9463 9474 .9484 .9495 .9505 .9515 .9525 .9535 .9545 1.7 .95 54 .9564 9573 .9582 .9591 9599 .9608 .9616 .9625 .9633 1.8 .9641 .9649 .9656 .9664 .9671 .9678 .9686 .9693 .9699 .9706 1.9 .9713 .9719 9726 .9732 .9738 .9744 .9750 .9756 .9761 .9767 2.0 .9772 .9778 9783 .9788 .9793 .9798 .9803 9808 .9812 .9817 anraThe height of women ages 2029 is normally distributed, with a mean of 63.6 inches. Assume a = 2.4 inches. Are you more likely to randomly select 1 woman with a height less than 65.5 inches or are you more likely to selecta sample of 1? women with a mean height less than 65.5 inches? Explain. a Click the icon to View page 1 of the standard normal table. E Click the icon to View page 2 of the standard normal table. What is the probability of randomly selecting 1 woman with a height less than 65.5 inches? (Round to four decimal places as needed.) What is the probability of selecting a sample of 1? women with a mean height less than 65.5 inches? (Round to four decimal places as needed.) Are you more likely to randomly select 1 woman with a height less than 65.5 inches or are you more likely to select a sample of 1? women with a mean height less than 65.5 inches? Choose the correct answer below. 0 A. It is more likely to select a sample of 1? women with a mean height less than 65.5 inches because the sample of 1? has a lower probability. 0 B. It is more likely to select 1 woman with a height less than 65.5 inches because the probability is higher. 0 C. It is more likely to select a sample of 1? women with a mean height less than 65.5 inches because the sample of 1? has a higher probability. 0 D. It is more likely to select 1 woman with a height less than 65.5 inches because the probability is lower. X Standard Normal Table (Page 1) .09 07 .06 05 04 03 02 01 00 - 3.4 .0002 .0003 .0003 0003 0003 0003 .0003 0003 0003 0003 - 3.3 .0003 .0004 .0004 .0004 .0004 0004 .0004 .0005 .0005 .0005 - 3.2 .0005 .0005 .0005 .0006 .0006 0006 .0006 .0006 .0007 0007 - 3.1 .0007 .0007 .0008 .0008 .0008 .0008 .0009 .0009 .0009 .0010 - 3.0 .0010 .0010 .0011 .0011 .0011 0012 .0012 .0013 .0013 0013 - 2.9 0014 .0014 .0015 .0015 .0016 .0016 .0017 .0018 .0018 0019 - 2.8 0019 .0020 .0021 .0021 .0022 0023 .0023 .0024 .0025 .0026 - 2.7 .0026 .0027 .0028 .0029 .0030 .0031 .0032 .0033 .0034 .0035 - 2.6 0036 .0037 .0038 .0039 .0040 0041 .0043 .0044 .0045 0047 - 2.5 .0048 .0049 .0051 .0052 .0054 0055 .0057 .0059 .0060 .0062 - 2.4 .0064 .0066 .0068 .0069 .0071 0073 .0075 .0078 .0080 0082 - 2.3 .0084 0087 .0089 .0091 .0094 0096 .0099 0102 .0104 0107 - 2.2 .0110 0113 .0116 .0119 .0122 0125 .0129 .0132 .0136 0139 - 2.1 0143 .0146 .0150 .0154 .0158 0162 .0166 .0170 .0174 0179 - 2.0 .0183 .0188 .0192 .0197 .0202 0207 .0212 .0217 .0222 .0228 - 1.9 .0233 .0239 .0244 .0250 .0256 0262 .0268 .0274 .0281 0287 - 1.8 0294 .0301 .0307 .0314 .0322 .0329 0336 .0344 .0351 0359 -1.7 .0367 .0375 .0384 .0392 .0401 0409 .0418 .0427 .0436 .0446 - 1.6 .0455 .0465 .0475 .0485 .0495 0505 .0516 .0526 .0537 .0548 - 1.5 .0559 .0571 .0582 .0594 .0606 0618 0630 .0643 .0655 0668 - 1.4 .0681 .0694 .0708 .0721 .0735 0749 .0764 .0778 .0793 .0808
Step by Step Solution
There are 3 Steps involved in it

Get step-by-step solutions from verified subject matter experts