

Question: Standard normal table: Standard normal table: Only part b needs an answer In a P system, the lead time for a box of weed-killer is


Standard normal table:


Standard normal table:
Only part b needs an answer
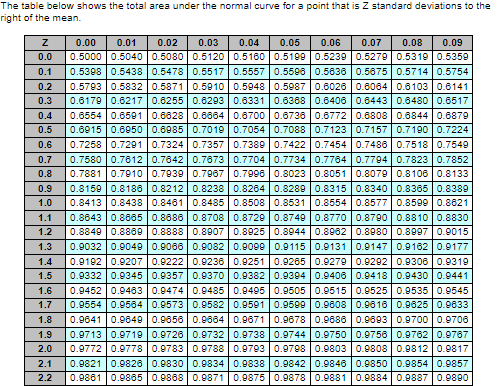
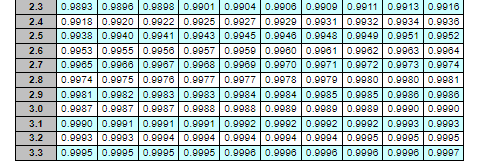
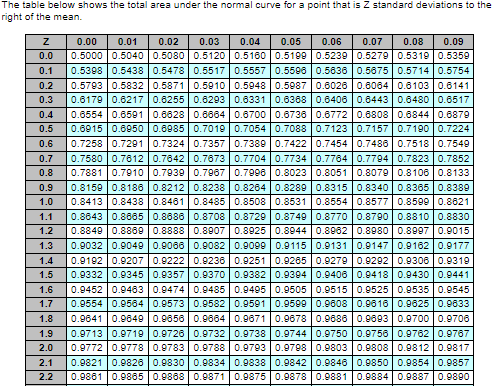
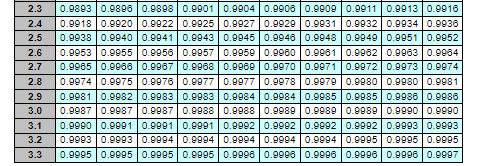
In a P system, the lead time for a box of weed-killer is three weeks and the review period is one week. Demand during the protection interval averages 223 boxes, with a standard deviation of demand during the protection interval of 50 boxes. a. What is the cycle-service level when the target inventory is set at 300 boxes? Refer to the standard normal table as needed. The cycle-service level is 93.82 %. (Enter your response rounded to two decimal places.) The table below shows the total area under the normal curve for a point that is Z standard deviations to the right of the mean. 0.0 0.1 0.2 0.3 0.4 0.5 0.6 0.7 0.8 0.9 1.0 1.1 1.2 1.3 1.4 1.5 1.6 1.7 1.8 0.00 0.01 0.02 0.03 0.04 0.05 0.06 0.07 0.08 0.09 0.5000 0.5040 0.5080 0.5120 0.51600.5199 0.5239 0.52790.5319 0.5359 0.5398 0.5438 0.5478 0.5517 0.5557 0.5596 0.5636 0.5675 0.5714 0.5754 0.5793 0.58320.58710.5910 0.5948 0.5987 0.6026 0.6064 0.6103 0.6141 0.6179 0.6217 0.6255 0.6293 0.6331 0.6388 0.6406 0.64430.8480 0.6517 0.65540.6591 0.6628 0.68640.6700 0.6736 0.6772 0.6808 0.68440.6879 0.6915 0.6950 0.6985 0.7019 0.7054 0.7088 0.7123 0.7157 0.7190 0.7224 0.7258 0.7291 0.7324 0.7357 0.7389 0.7422 0.7454 0.7486 0.75180.7549 0.7580 0.7612 0.78420.7673 0.77040.77340.7764 0.77940.78230.7852 0.7881 0.7910 0.7939 0.7967 0.7996 0.8023 0.8051 0.8079 0.8106 0.8133 0.8159 0.8186 0.8212 0.8238 0.8264 0.8289 0.8315 0.8340 0.8365 0.8389 0.8413 0.8438 0.8461 0.8485 0.8508 0.8531 0.85540.8577 0.8599 0.8621 0.8643 0.8665 0.8686 0.8708 0.8729 0.8749 0.8770 0.8790 0.8810 0.8830 0.8849 0.8869 0.8888 | 0.89070.8925 0.8944 0.8982 0.89800.8997 0.9015 0.9032 0.9049 0.9066 0.9082 0.9099 0.9115 0.9131 0.9147 0.91620.9177 0.9192 0.9207 0.9222 0.9236 0.9251 0.9205 0.9279 0.9292 0.9306 0.9319 0.9332 0.9345 0.9357 0.9370 0.93820.9394 0.9406 0.9418 0.9430 0.9441 0.9452 0.9483 0.9474 0.9485 0.9495 0.9505 0.9515 0.9525 0.9535 0.9545 0.9554 0.95640.9573 0.9582 0.9591 0.9599 0.9808 0.9816 0.9625 0.9633 0.9641 0.9649 0.9656 0.98640.9671 0.9678 0.9886 0.9893 0.9700 0.9706 0.9713 0.9719 0.9726 0.9732 0.9738 0.9744 0.9750 0.9756 0.9762 0.9767 0.9772 0.9778 0.97830.9788 0.9793 0.9798 0.98030.9808 0.98120.9817 0.9821 0.9826 0.9830 0.9834 0.9838 0.98420.9846 0.9850 0.9854 0.9857 0.9861 0.9865 0.9868 0.98710.98750.9878 0.9881 0.9884 0.9887 0.9890 LLLL 1.9 2.0 2.1 2.2 3.3 268609666 098680 9686 09866 09666 09668 098680 9686 098660 968609666 098680 +6880 +866 078660 +6680 +668086880 8866 0 8668 016660 2668 02866 02866026660 1668 016660 166600886 0 0668006660 6868 0 6866 0 6866 088660 8868 02868 02866 02866 0 9866 09866 098680 98660 7866 07866 0 868 09868078860 1866 0 8680086600866 0 6266 0826602266 02268 09468092660266 0 3.2 3.1 3.0 2.9 2.8 2.7 2.6 0.9965 0.9966 0.9967 0.9968 0.9969 0.9970 0.9971 0.9972 0.9973 0.9974 0.9953 0.9955 0.9956 0.99570.99590.9960 0.9981 0.99620.9963 0.9984 2966019660 676808766 09766091660 +680 +6800166 08886 0 988801 88870 78880 | 18880 | 878801 27880 | 97880 | 2788701078801 81880 91660 1680 16806086 09066 07066 01068 0 868809686 08686 0 2.5 2.4 2.3 b. In the fall season demand for weed-killer decreases but also becomes more highly variable. Assume that during the fall season demand during the protection interval is expected to decrease to 170 boxes, but with a standard deviation of demand during the protection interval of 60 boxes. What would be the cycle-service level if management keeps the target inventory level set at 300 boxes? Refer to the standard normal table as needed. The cycle-service level would be % (Enter your response rounded to two decimal places.) The table below shows the total area under the normal curve for a point that is Z standard deviations to the right of the mean. z 0.0 0.1 0.2 0.3 0.4 0.5 0.6 0.7 0.8 0.9 1.0 1.1 1.2 1.3 1.4 1.5 1.6 1.7 1.8 1.9 2.0 2.1 2.2 0.00 0.01 0.02 0.03 0.04 0.05 0.06 0.07 0.08 0.09 0.5000 0.5040 0.50800.5120 0.51600.5199 0.5239 0.5279 0.5319 0.5359 0.5398 0.5438 0.5478 0.5517 0.5557 0.5598 0.5636 0.5875 0.5714 0.5754 0.5793 0.5832 0.58710.5910 0.5948 0.5987 0.6026 0.6064 0.6103 0.6141 0.61790.6217 0.6255 0.6293 0.6331 0.6388 0.6406 0.6443 0.6480 0.6517 0.65540.6591 0.6628 0.68640.6700 0.6736 0.6772 0.6808 0.68440.6879 0.6915 0.6950 0.6985 0.7019 0.7054 0.7088 0.7123 0.7157 0.7190 0.7224 0.7258 0.7291 0.7324 0.7357 0.7389 0.7422 0.7454 0.7486 0.75180.7549 0.7580 0.7612 0.76420.7673 0.77040.77340.7764 0.77940.78230.7852 0.7881 0.79100.7939 0.7967 0.7996 0.8023 0.8051 0.8079 0.8106 0.8133 0.8159 0.8186 0.8212 0.8238 0.8264 0.8289 0.8315 0.8340 0.8365 0.8389 0.8413 0.8438 0.8461 0.8485 0.8508 0.8531 0.85540.85770.8599 0.8621 0.86430.8665 0.8686 0.8708 0.8729 0.8749 0.8770 0.8790 0.8810 0.8830 0.8849 0.8869 0.8888 0.8907 0.8925 0.8944 0.89620.89800.8997 0.9015 0.9032 0.9049 0.9066 0.9082 0.9099 0.9115 0.9131 0.9147 0.9162 0.9177 0.9192 0.9207 0.9222 0.9236 0.9251 0.9265 0.9279 0.92920.9306 0.9319 0.9332 0.9345 0.9357 0.93700.93820.9394 0.9406 0.94180.9430 0.9441 0.94520.9483 0.9474 0.9485 0.9495 0.9505 0.9515 0.9525 0.9535 0.9545 0.9554 0.9584 0.9573 0.9582 0.9591 0.9599 0.9808 0.98160.9625 0.9633 0.9641 0.9849 0.9656 0.9664 0.9671 0.9678 0.9886 0.9693 0.9700 0.9706 0.97130.9719 0.9726 0.9732 0.9738 0.9744 0.9750 0.97560.9762 0.9767 0.9772 0.9778 0.97830.9788 0.9793 0.9798 0.98030.9808 0.98120.9817 0.9821 0.9826 0.9830 0.98340.9838 0.98420.9846 0.9850 0.98540.9857 0.9861 0.98650.9868 0.98710.98750.9878 0.9881 0.9884 0.9887 0.9890 | 2.3 2.4 2.5 2.6 2.7 2.8 2.9 3.0 3.1 3.2 3.3 0.9893 0.9896 0.9898 0.9901 0.99040.9906 0.9909 0.99110.99130.9916 0.9918 0.9920 0.99220.9925 0.99270.9929 0.9931 0.99320.9934 0.9936 0.9938 0.9940 0.9941 0.99430.9945 0.9948 0.9948 0.9949 0.9951 0.9952 0.9953 0.9955 0.9956 0.9957 0.99590.9900 0.9981 0.9962 0.99630.9984 0.9985 0.9986 0.99870.9968 0.9969 0.9970 0.9971 0.9972 0.99730.9974 0.99740.9975 0.9978 0.9977 0.9977 0.9978 0.9979 0.99800.99800.9981 0.9981 0.99820.9983 0.9983 0.99840.9984 0.9985 0.9985 0.9988 0.9986 0.9987 0.9987 0.9987 0.9988 0.9988 0.9989 0.9989 0.9989 0.9990 0.9990 0.9990 0.9991 0.9991 0.9991 0.99920.9992 0.9992 0.9992 0.9993 0.9993 0.9993 0.9993 0.99940.9994 0.9994 0.9994 0.9994 0.9995 0.9995 0.9995 0.9995 0.9995 0.9995 0.9995 0.9998 0.9997 0.9996 0.9996 0.9996 0.9997Step by Step Solution
There are 3 Steps involved in it
1 Expert Approved Answer
Step: 1 Unlock

Question Has Been Solved by an Expert!
Get step-by-step solutions from verified subject matter experts
Step: 2 Unlock
Step: 3 Unlock