

Question: Starting with the code and data below, modify and extend it to: 1. Update the default colour map with a map of your choice (1
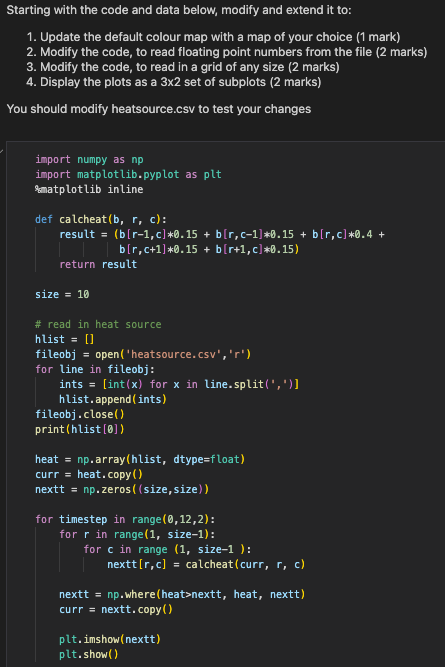

Starting with the code and data below, modify and extend it to: 1. Update the default colour map with a map of your choice (1 mark) 2. Modify the code, to read floating point numbers from the file ( 2 marks) 3. Modify the code, to read in a grid of any size ( 2 marks) 4. Display the plots as a 32 set of subplots ( 2 marks) You should modify heatsource.csv to test your changes 123456789100,0,0,0,0,0,0,0,0,00,0,0,0,0,0,0,0,0,00,0,10,0,0,0,10,0,0,00,0,10,10,0,0,10,10,0,00,0,0,0,0,0,0,0,0,00,0,0,0,0,0,0,0,0,00,0,7,0,0,0,0,7,0,00,0,0,10,10,10,10,0,0,00,0,0,0,0,0,0,0,0,00,0,0,0,0,0,0,0,0,0
Step by Step Solution
There are 3 Steps involved in it
1 Expert Approved Answer
Step: 1 Unlock

Question Has Been Solved by an Expert!
Get step-by-step solutions from verified subject matter experts
Step: 2 Unlock
Step: 3 Unlock