

Question: STAT 213 ALL - (W X 213 4.3 solved - STAT 213 ALL - X 213 4.2 solved - STAT 213 ALL - X _
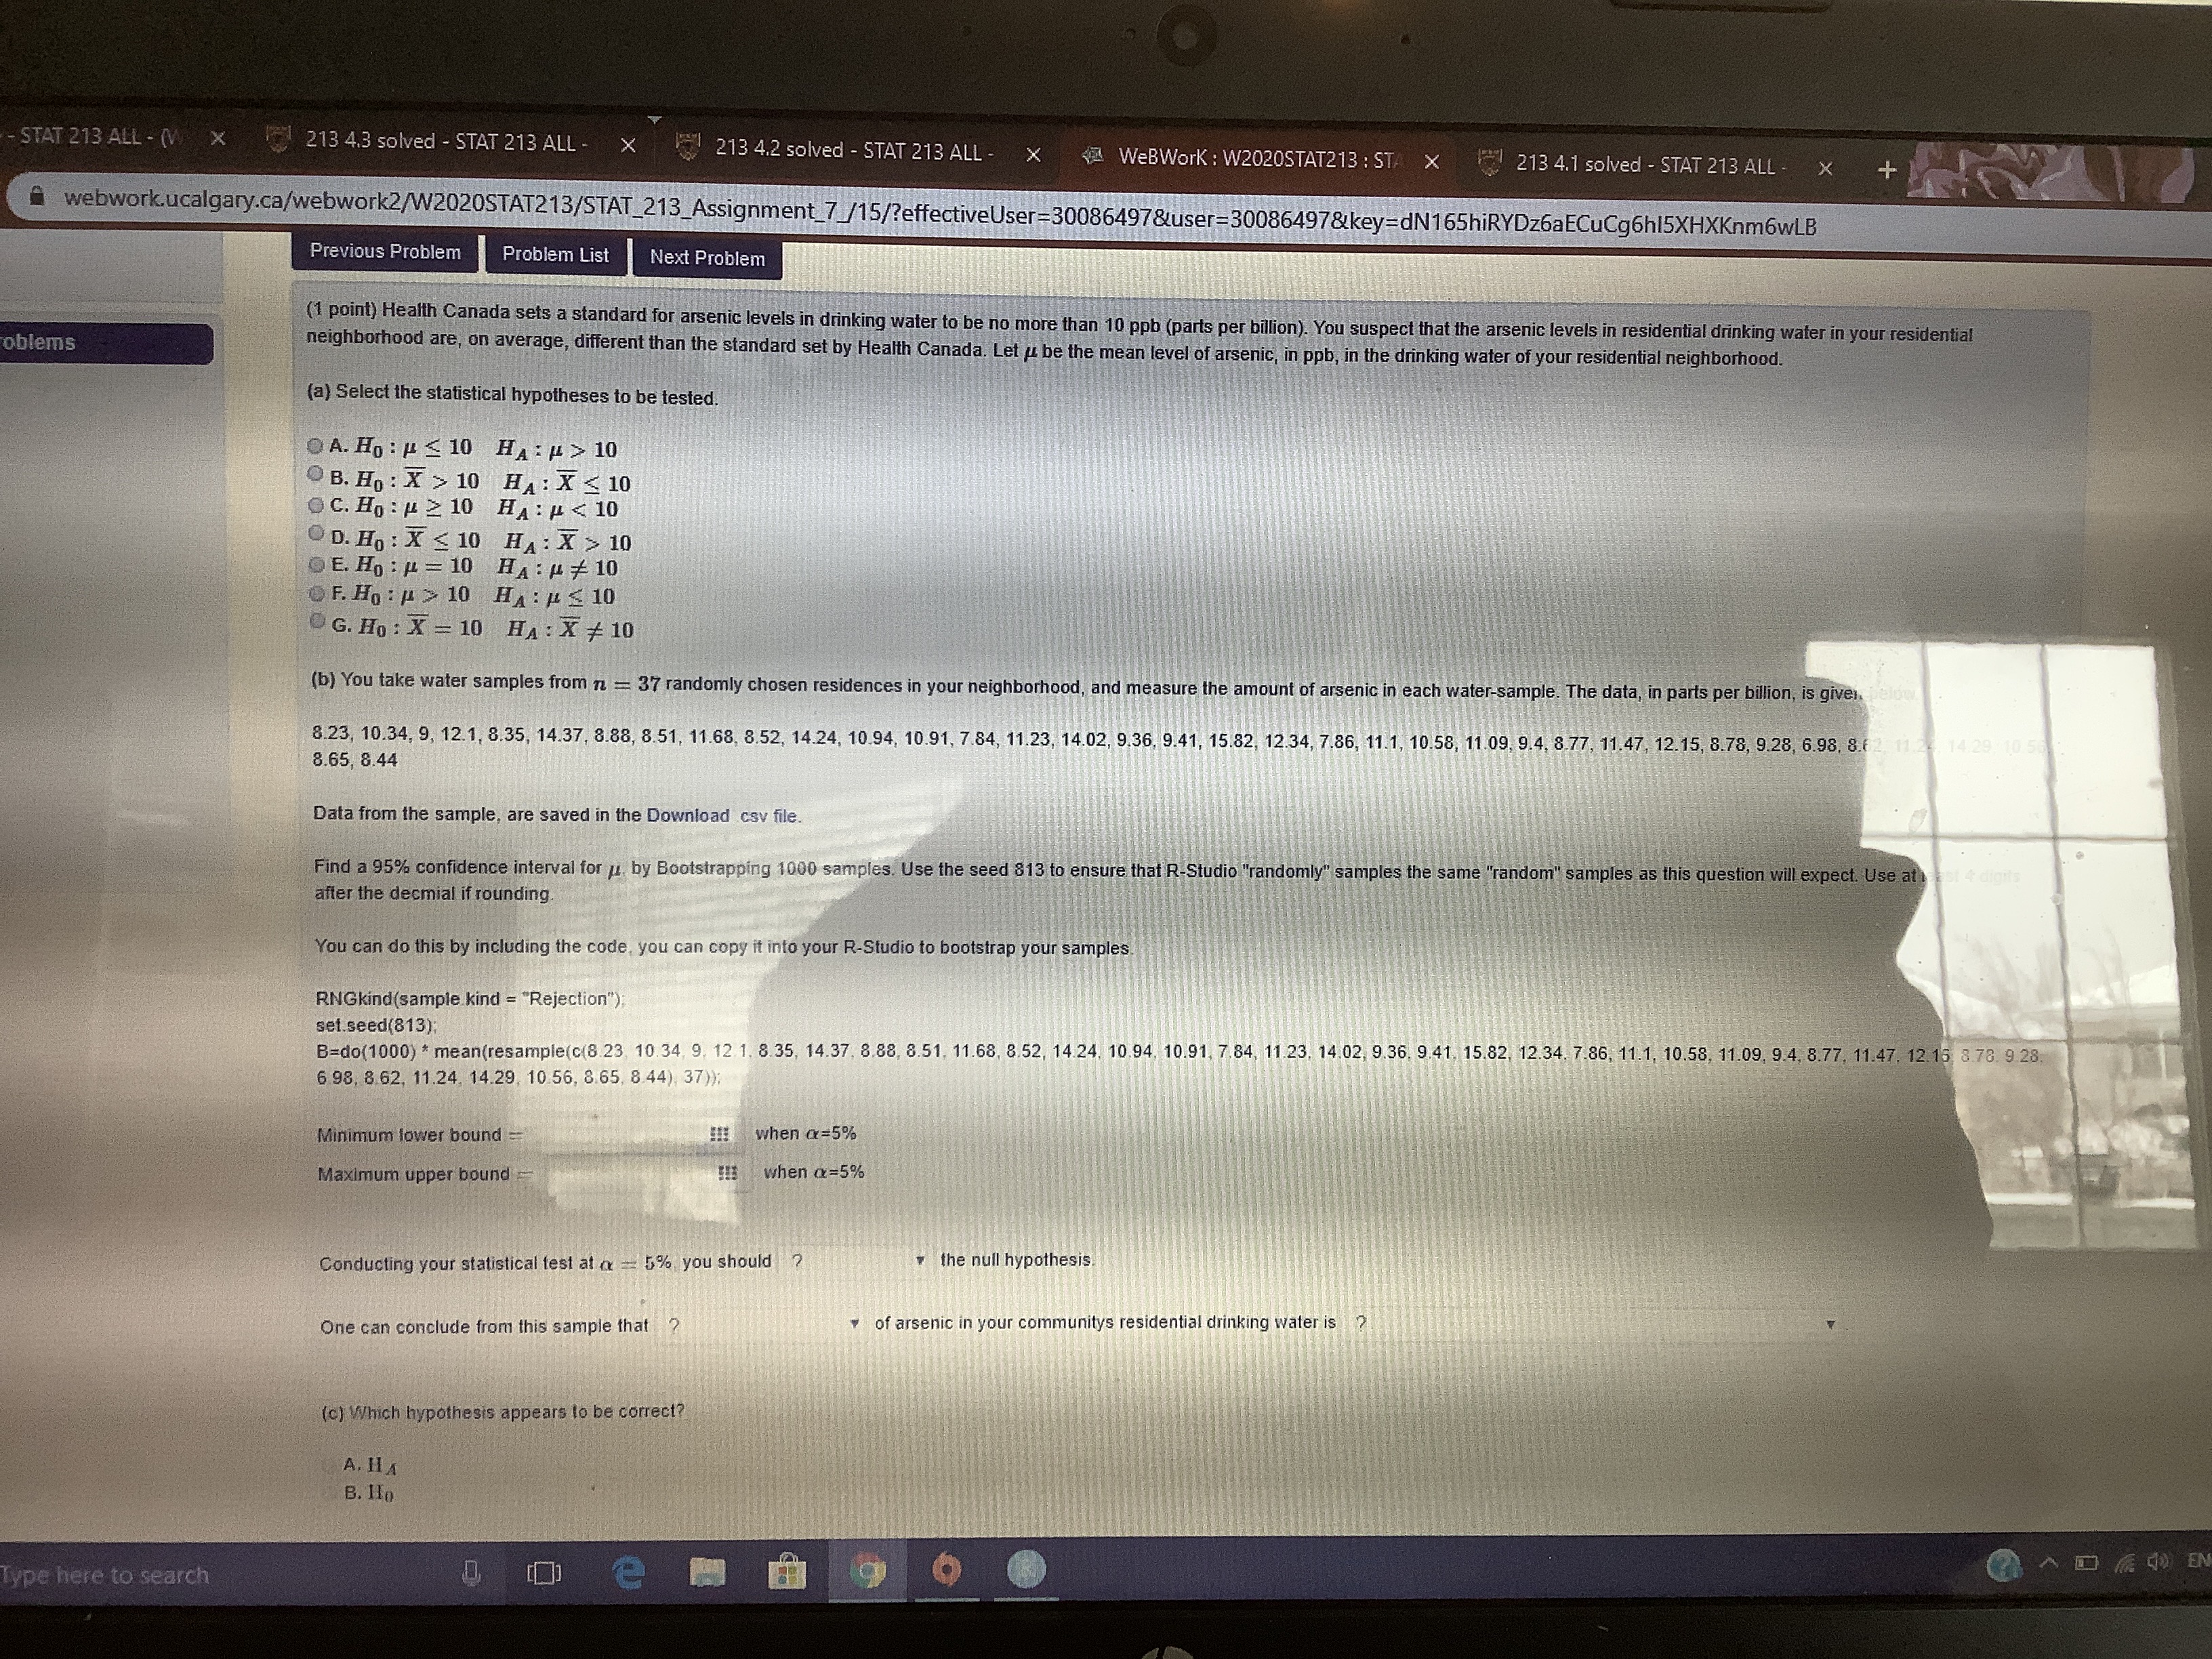
STAT 213 ALL - (W X 213 4.3 solved - STAT 213 ALL - X 213 4.2 solved - STAT 213 ALL - X _ WeBWork : W2020STAT213 : ST. X 213 4.1 solved - STAT 213 ALL - " webwork.ucalgary.ca/webwork2/W2020STAT213/STAT_213_Assignment_7_/15/?effectiveUser=30086497&user=30086497&key=dN165hiRYDz6aECuCg6h15XHXKnm6wLB Previous Problem Problem List Next Problem (1 point) Health Canada sets a standard for arsenic levels in drinking water to be no more than 10 ppb (parts per billion). You suspect that the arsenic levels in residential drinking water in your residential oblems neighborhood are, on average, different than the standard set by Health Canada. Let / be the mean level of arsenic, in ppb, in the drinking water of your residential neighborhood. (a) Select the statistical hypotheses to be tested OA. Ho : / 10 O B. Ho : X > 10 HA : X = 10 C. Ho : # 2 10 HA : P 10 OE. Ho : / = 10 HA : P # 10 OF. Ho : 4 > 10 HA : HE 10 G. Ho : X = 10 HA : X # 10 (b) You take water samples from n = 37 randomly chosen residences in your neighborhood, and measure the amount of arsenic in each water-sample. The data, in parts per billion, is giver. 8.23, 10.34, 9, 12.1, 8.35, 14.37, 8.88, 8.51, 11.68, 8.52, 14.24, 10.94, 10.91, 7.84, 11.23, 14.02, 9.36, 9.41, 15.82, 12.34, 7.86, 11.1, 10.58, 11.09, 9.4, 8.77, 11.47, 12.15, 8.78, 9.28, 6.98, 8.6 8.65, 8.44 Data from the sample, are saved in the Download cav file. Find a 95% confidence interval for / by Bootstrapping 1000 samples. Use the seed 813 to ensure that R-Studio "randomly" samples the same "random" samples as this question will expect. Use at after the decmial if rounding. You can do this by including the code, you can copy it into your R-Studio to bootstrap your samples. RNGkind(sample kind = "Rejection") set.seed(813); B=do(1000) * mean(resample(c(8.23, 10.34, 9, 12 1. 8.35, 14.37, 8.88, 8.51. 11.68, 8.52, 14 24, 10.94, 10.91, 7.84, 11 23, 14 02, 9.36, 9.41, 15.82, 12.34. 7.86, 11.1, 10.58, 11.09, 9.4, 8.77, 11.47. 12.15 8.78. 9 28, 6 98, 8 62, 11.24, 14.29, 10 56, 8.65, 8 44), 37)), Minimum lower bound = 1!! when a=5% Maximum upper bound when a=5% Conducting your statistical fest at a = 5% you should the null hypothesis. One can conclude from this sample that of arsenic in your communitys residential drinking water is ? (c) Which hypothesis appears to be correct? A. HA B. Ho type here to search e
Step by Step Solution
There are 3 Steps involved in it

Get step-by-step solutions from verified subject matter experts