Question: STAT 300 Assignment 1 (Chapter 1) Instructions On a separate sheet of paper (or sheets) solve the following problems. Be sure to write neatly, show
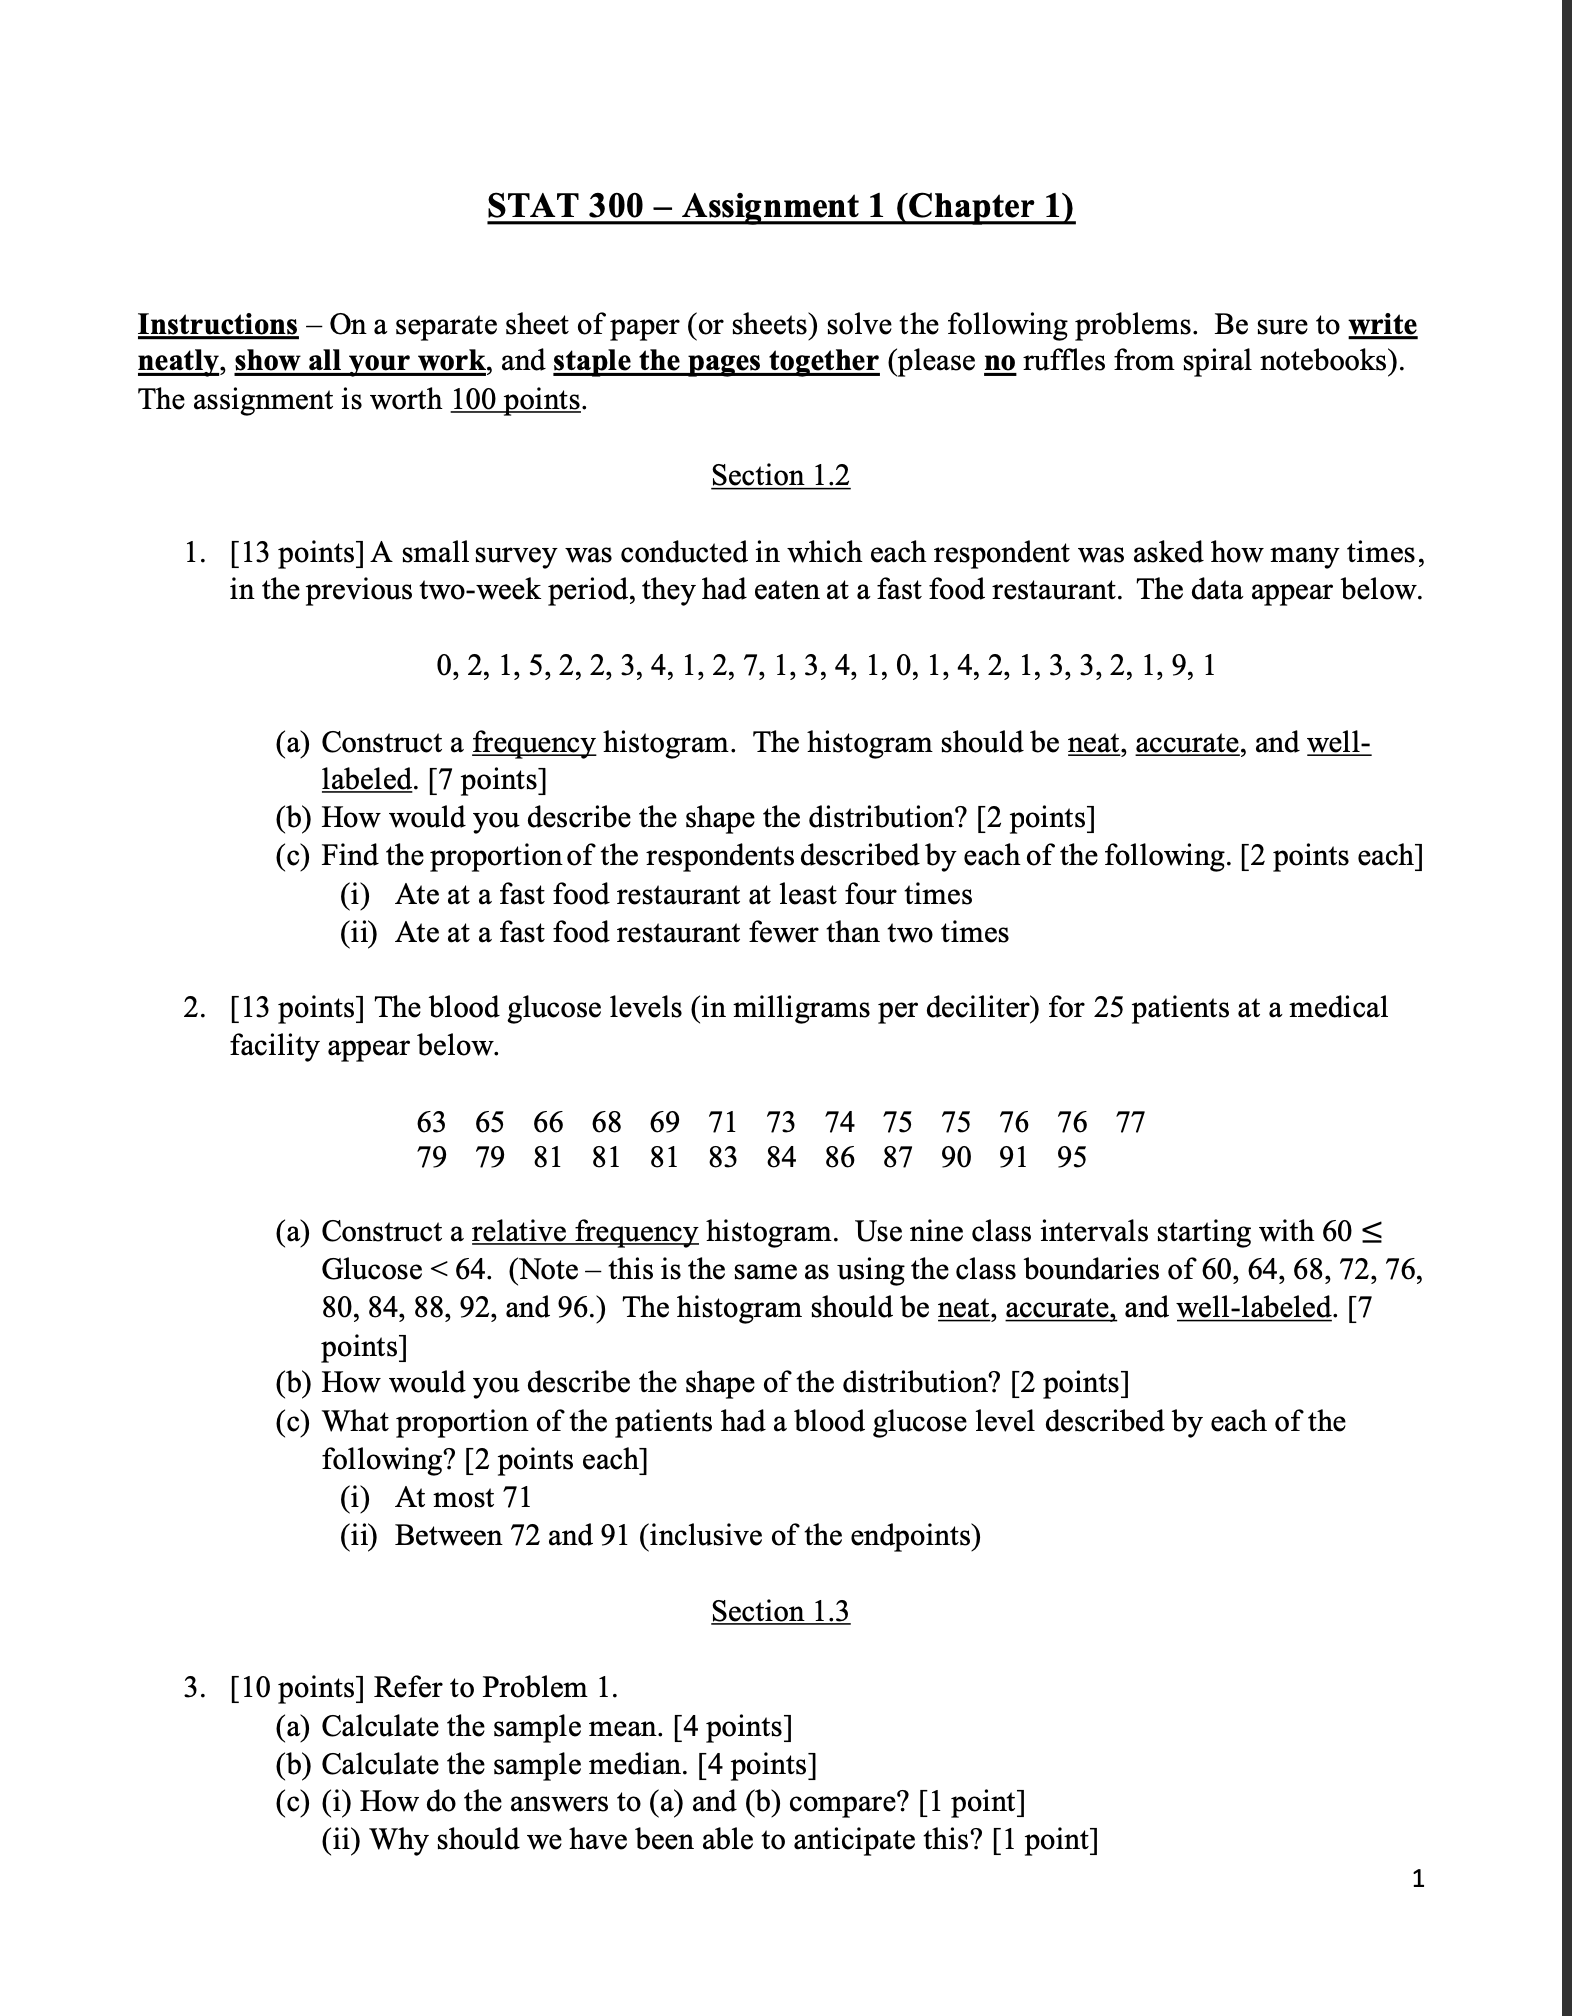
STAT 300 Assignment 1 (Chapter 1) Instructions On a separate sheet of paper (or sheets) solve the following problems. Be sure to write neatly, show all your work, and staple the pages together (please no ruffles from spiral notebooks). The assignment is worth 100 points. Section 1.2 1. [13 points] A small survey was conducted in which each respondent was asked how many times, in the previous two-week period, they had eaten at a fast food restaurant. The data appear below. 0,2,1,52,2,3,41,2,7,1,3,41,0,1,4,2,1,3,3,2,1,9,1 (a) Construct a frequency histogram. The histogram should be neat, accurate, and well- labeled. [7 points] (b) How would you describe the shape the distribution? [2 points] (c) Find the proportion of the respondents described by each of the following. [2 points each] (i) Ate at a fast food restaurant at least four times (ii) Ate at a fast food restaurant fewer than two times 2. [13 points] The blood glucose levels (in milligrams per deciliter) for 25 patients at a medical facility appear below. 63 65 66 68 69 71 73 74 75 75 76 76 77 79 79 81 81 81 83 84 86 87 90 91 95 (a) Construct a relative frequency histogram. Use nine class intervals starting with 60
Step by Step Solution
There are 3 Steps involved in it
1 Expert Approved Answer
Step: 1 Unlock
Question Has Been Solved by an Expert!
Get step-by-step solutions from verified subject matter experts
Step: 2 Unlock
Step: 3 Unlock
Students Have Also Explored These Related Mathematics Questions!