

Question: STAT 4330 / Categorical data analysis A survey asked people how often they exceed speed limits. The data are then categorized into the following contingency
STAT 4330 / Categorical data analysis

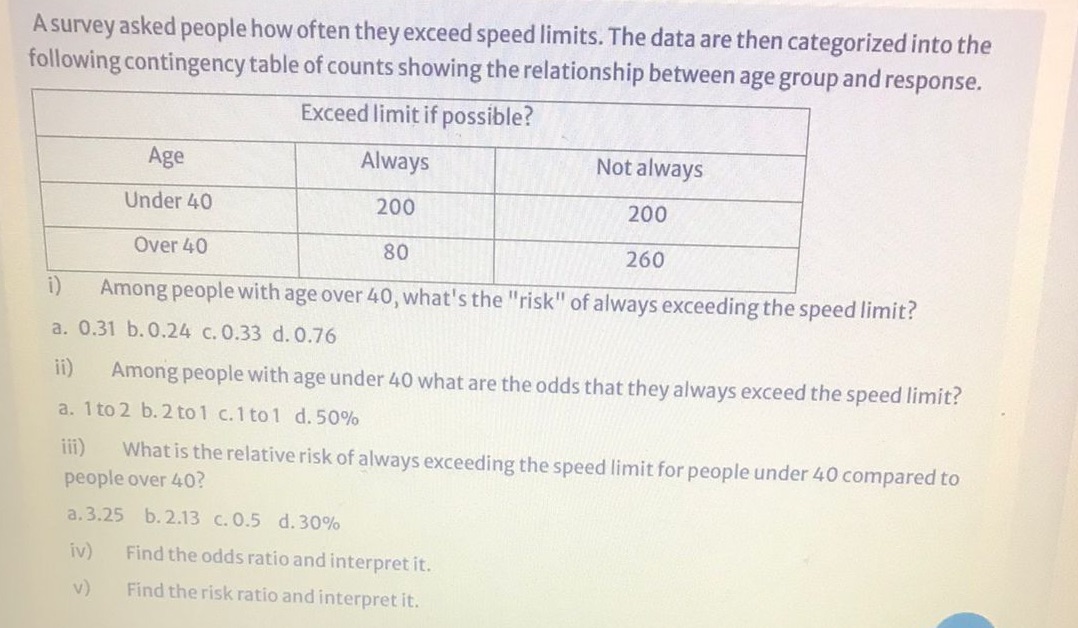
A survey asked people how often they exceed speed limits. The data are then categorized into the following contingency table of counts showing the relationship between age group and response. Exceed limit if possible? Age Always Not always Under 40 200 200 Over 40 80 260 i) Among people with age over 40, what's the "risk" of always exceeding the speed limit? a. 0.31 b. 0.24 c. 0.33 d. 0.76 ii) Among people with age under 40 what are the odds that they always exceed the speed limit? a. 1to 2 b. 2 to1 c. 1 to 1 d. 50% iii) What is the relative risk of always exceeding the speed limit for people under 40 compared to people over 40? a. 3.25 b. 2.13 c. 0.5 d. 30% iv) Find the odds ratio and interpret it. v ) Find the risk ratio and interpret it
Step by Step Solution
There are 3 Steps involved in it

Get step-by-step solutions from verified subject matter experts