

Question: STATA: Would anyone know the code syntax to get a table similar to this in STATA Common mental disorder Ethnic identity Total sample, n Migration
STATA:
Would anyone know the code syntax to get a table similar to this in STATA
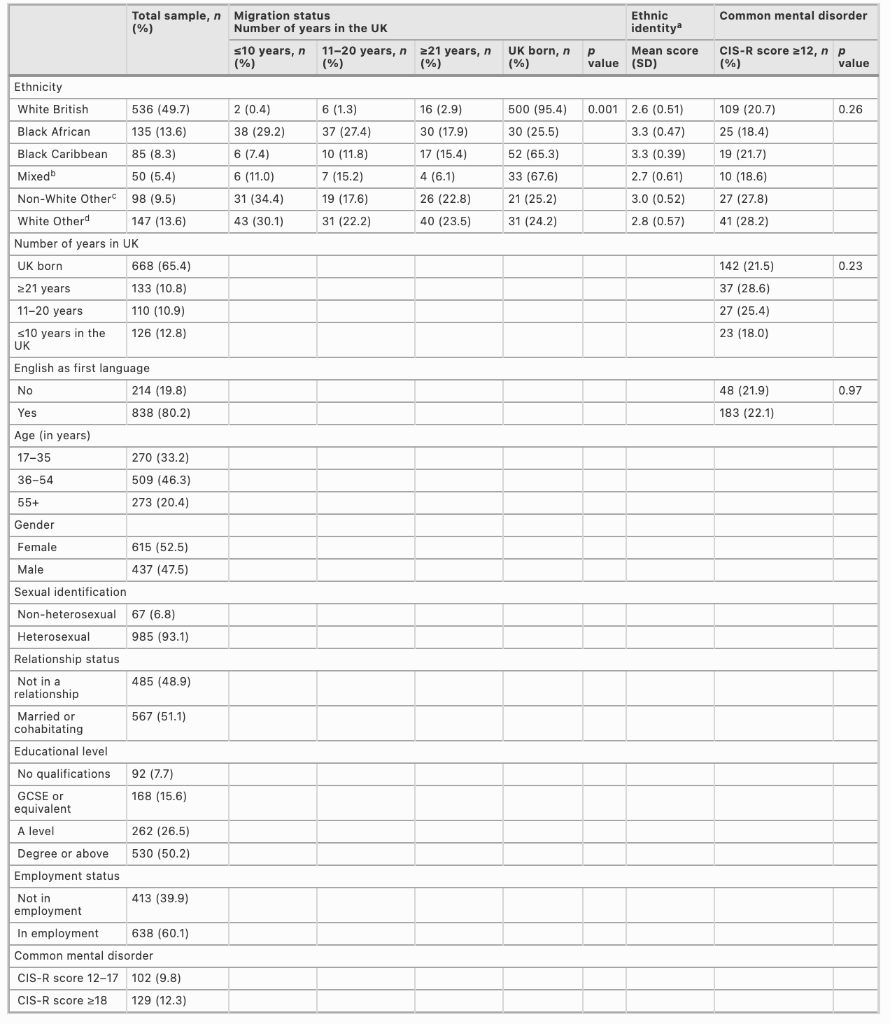
Common mental disorder Ethnic identity Total sample, n Migration status (%) Number of years in the UK s10 years, n 11-20 years, n (%) (%) 221 years, n (%) UK born, n (%) p Mean score value (SD) CIS-R score 212, np (%) value 0.26 2 (0.4) 38 (29.2) 6 (7.4) 6 (11.0) 31 (34.4) 43 (30.1) 6 (1.3) 37 (27.4) 10 (11.8) 7 (15.2) 19 (17.6) 31 (22.2) 16 (2.9) 30 (17.9) 17 (15.4) 4 (6.1) 26 (22.8) 40 (23.5) 500 (95.4) 30 (25.5) 52 (65.3) 33 (67.6) 21 (25.2) 31 (24.2) 0.001 2.6 (0.51) 3.3 (0.47) 3.3 (0.39) 2.7 (0.61) 3.0 (0.52) 2.8 (0.57) 109 (20.7) 25 (18.4) 19 (21.7) 10 (18.6) 27 (27.8) 41 (28.2) Ethnicity White British 536 (49.7) Black African 135 (13.6) Black Caribbean 85 (8.3) Mixedb 50 (5.4) Non-White Other 98 (9.5) White Other 147 (13.6) Number of years in UK UK born 668 (65.4) 221 years 133 (10.8) 11-20 years 110 (10.9) s10 years in the 126 (12.8) UK English as first language No 214 (19.8) Yes 838 (80.2) 0.23 142 (21.5) 37 (28.6) 27 (25.4) 23 (18.0) 0.97 48 (21.9) 183 (22.1) Age (in years) 17-35 36-54 270 (33.2) 509 (46.3) 273 (20.4) 55+ Gender Female 615 (52.5) Male 437 (47.5) Sexual identification Non-heterosexual 67 (6.8) Heterosexual 985 (93.1) Relationship status Not in a 485 (48.9) relationship Married or 567 (51.1) cohabitating Educational level No qualifications 92 (7.7) GCSE or 168 (15.6) equivalent A level 262 (26.5) Degree or above 530 (50.2) Employment status Not in 413 (39.9) employment In employment 638 (60.1) Common mental disorder CIS-R score 12-17 102 (9.8) CIS-R score 218 129 (12.3) Common mental disorder Ethnic identity Total sample, n Migration status (%) Number of years in the UK s10 years, n 11-20 years, n (%) (%) 221 years, n (%) UK born, n (%) p Mean score value (SD) CIS-R score 212, np (%) value 0.26 2 (0.4) 38 (29.2) 6 (7.4) 6 (11.0) 31 (34.4) 43 (30.1) 6 (1.3) 37 (27.4) 10 (11.8) 7 (15.2) 19 (17.6) 31 (22.2) 16 (2.9) 30 (17.9) 17 (15.4) 4 (6.1) 26 (22.8) 40 (23.5) 500 (95.4) 30 (25.5) 52 (65.3) 33 (67.6) 21 (25.2) 31 (24.2) 0.001 2.6 (0.51) 3.3 (0.47) 3.3 (0.39) 2.7 (0.61) 3.0 (0.52) 2.8 (0.57) 109 (20.7) 25 (18.4) 19 (21.7) 10 (18.6) 27 (27.8) 41 (28.2) Ethnicity White British 536 (49.7) Black African 135 (13.6) Black Caribbean 85 (8.3) Mixedb 50 (5.4) Non-White Other 98 (9.5) White Other 147 (13.6) Number of years in UK UK born 668 (65.4) 221 years 133 (10.8) 11-20 years 110 (10.9) s10 years in the 126 (12.8) UK English as first language No 214 (19.8) Yes 838 (80.2) 0.23 142 (21.5) 37 (28.6) 27 (25.4) 23 (18.0) 0.97 48 (21.9) 183 (22.1) Age (in years) 17-35 36-54 270 (33.2) 509 (46.3) 273 (20.4) 55+ Gender Female 615 (52.5) Male 437 (47.5) Sexual identification Non-heterosexual 67 (6.8) Heterosexual 985 (93.1) Relationship status Not in a 485 (48.9) relationship Married or 567 (51.1) cohabitating Educational level No qualifications 92 (7.7) GCSE or 168 (15.6) equivalent A level 262 (26.5) Degree or above 530 (50.2) Employment status Not in 413 (39.9) employment In employment 638 (60.1) Common mental disorder CIS-R score 12-17 102 (9.8) CIS-R score 218 129 (12.3)
Step by Step Solution
There are 3 Steps involved in it

Get step-by-step solutions from verified subject matter experts