

Question: State what you would plot to get a straight line if experimental ( x , y ) data are to be correlated by the following
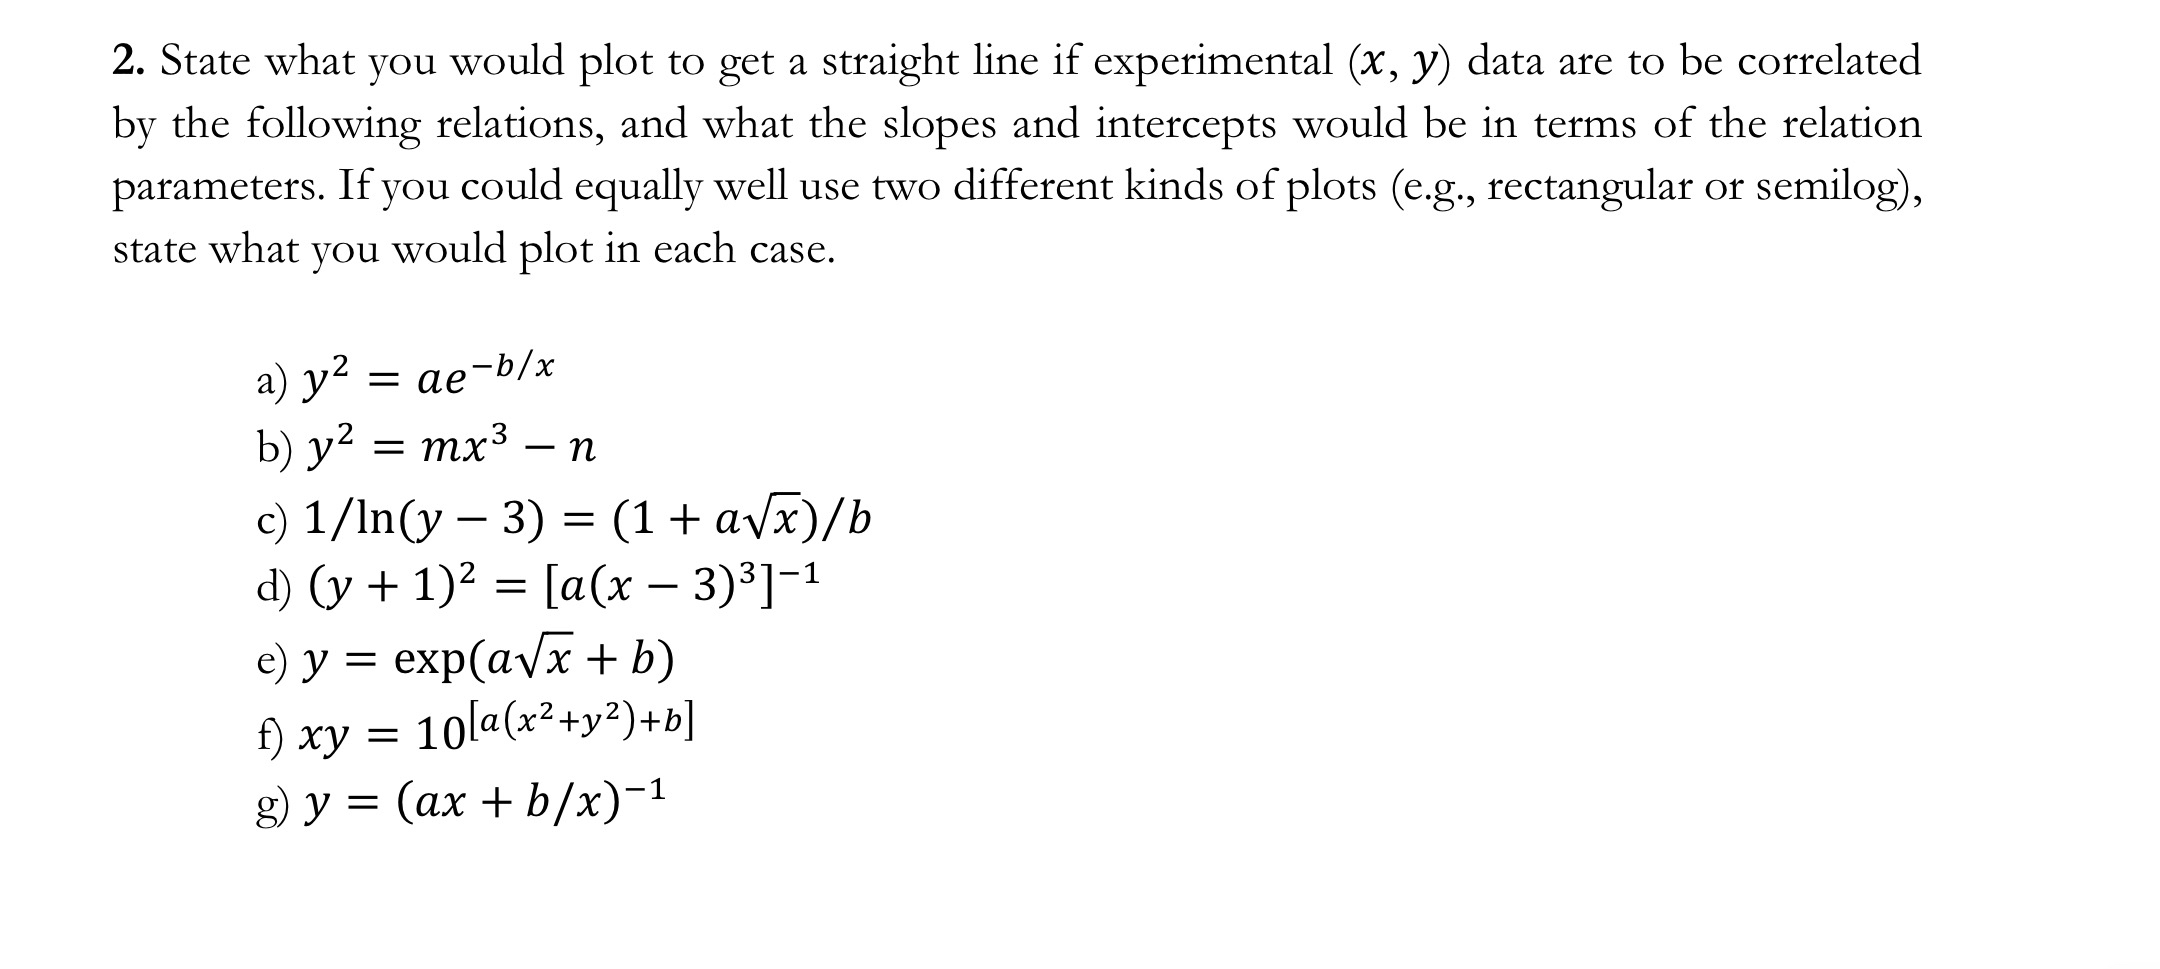
State what you would plot to get a straight line if experimental data are to be correlated by the following relations, and what the slopes and intercepts would be in terms of the relation parameters. If you could equally well use two different kinds of plots eg rectangular or semilog state what you would plot in each case.
a
b
c
d
eexp
f
g
Step by Step Solution
There are 3 Steps involved in it
1 Expert Approved Answer
Step: 1 Unlock

Question Has Been Solved by an Expert!
Get step-by-step solutions from verified subject matter experts
Step: 2 Unlock
Step: 3 Unlock