

Question: statement data for Queen Products Compan y are presented below. All balance sheet data are as of December 31 2017 2016 $762,500 $715,000 478,500 438,000
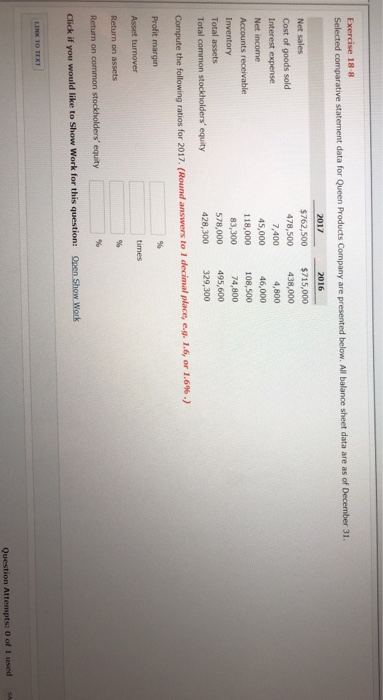
statement data for Queen Products Compan y are presented below. All balance sheet data are as of December 31 2017 2016 $762,500 $715,000 478,500 438,000 4,800 45,000 46,000 18,000 108,500 74,800 578,000 495,600 428,300 329,300 Cost of goods sold Interest expense Net income 7,400 Inventory 83,300 Compute the following ratios for 2017. (Round answers to 1 decimal place, e.g. 1.6, or 1.6% .) Asset turnover times Return on assets Click if you would like to Show Work for this question: Question Attempts: 0 of 1 used
Step by Step Solution
There are 3 Steps involved in it
1 Expert Approved Answer
Step: 1 Unlock

Question Has Been Solved by an Expert!
Get step-by-step solutions from verified subject matter experts
Step: 2 Unlock
Step: 3 Unlock