

Question: Statement of cash flows-indirect method Instructions Labels and Amount Descriptions Statement of Cash Flows Final Question Instructions The comparative balance sheet of Olson-Jones Industries Inc.
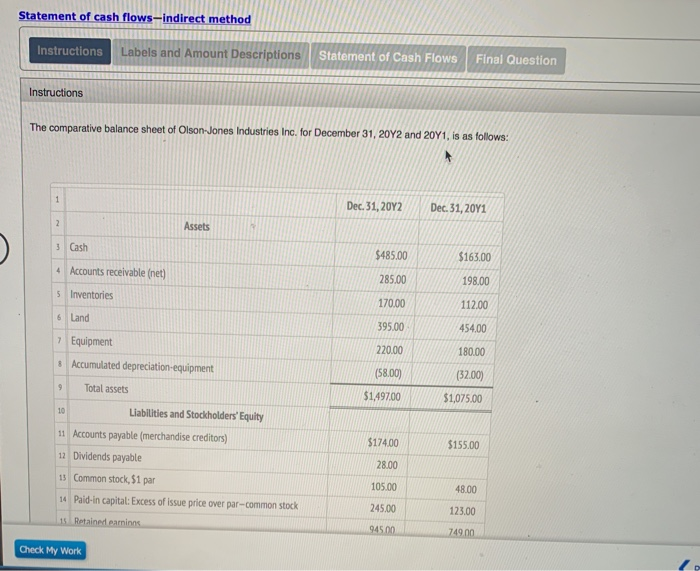
Statement of cash flows-indirect method Instructions Labels and Amount Descriptions Statement of Cash Flows Final Question Instructions The comparative balance sheet of Olson-Jones Industries Inc. for December 31, 20Y2 and 2041, is as follows: Dec 31, 20Y2 Dec. 31, 20Y1 Assets 3 Cash $485.00 $163.00 4 Accounts receivable (net) 198.00 5 Inventories 112.00 6 Land 285.00 170.00 395.00 220.00 454.00 Equipment 180.00 (32.00) (58.00) $1,497.00 $1,075.00 * Accumulated depreciation-equipment Total assets Liabilities and Stockholders' Equity 11 Accounts payable (merchandise creditors) 12 Dividends payable $17400 $155.00 13 Common stock, $1 par 28.00 105.00 245.00 48.00 14 Paid-in capital: Excess of issue price over par-common stock 123.00 15 Retained earninn 9450 749.00 Check My Work Statement of cash flows-indirect method Instructions Labels and Amount Descriptions Statement of Cash Flows Final Question Instructions The comparative balance sheet of Olson-Jones Industries Inc. for December 31, 20Y2 and 2041, is as follows: Dec 31, 20Y2 Dec. 31, 20Y1 Assets 3 Cash $485.00 $163.00 4 Accounts receivable (net) 198.00 5 Inventories 112.00 6 Land 285.00 170.00 395.00 220.00 454.00 Equipment 180.00 (32.00) (58.00) $1,497.00 $1,075.00 * Accumulated depreciation-equipment Total assets Liabilities and Stockholders' Equity 11 Accounts payable (merchandise creditors) 12 Dividends payable $17400 $155.00 13 Common stock, $1 par 28.00 105.00 245.00 48.00 14 Paid-in capital: Excess of issue price over par-common stock 123.00 15 Retained earninn 9450 749.00 Check My Work
Step by Step Solution
There are 3 Steps involved in it

Get step-by-step solutions from verified subject matter experts