Question: Statement of the Problem: Based upon the data found, you must state what is the data about and what is the intent of examining this
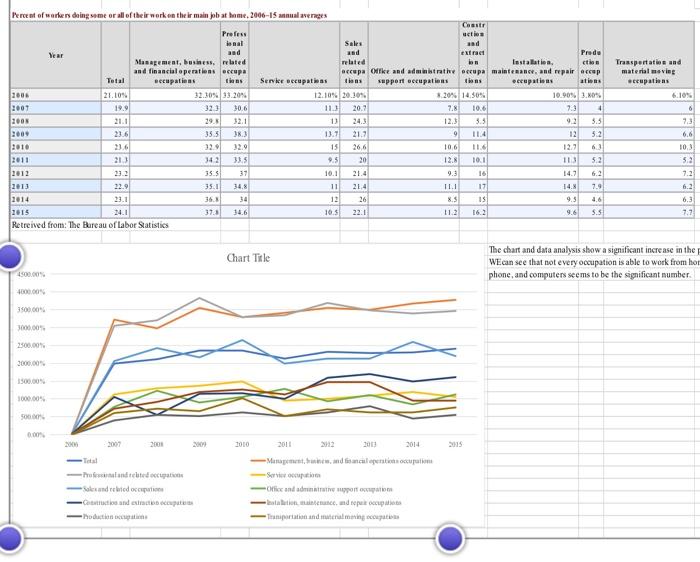
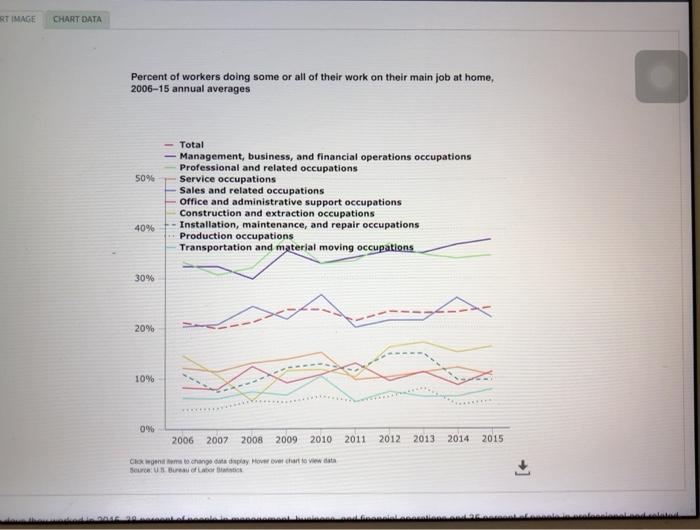
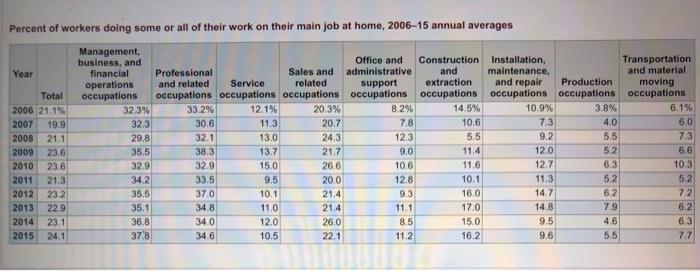
Statement of the Problem: Based upon the data found, you must state what is the data about and what is the intent of examining this data set. You should also answer the following questions: 1. the specific topic that you will research is Remote and Tele-Commuting to Save Money 1. What do you hope to get from examining this data/research Remote and Tele- Commuting to Save Money 2. How is Remote and Tele-Commuting to Save Money related to Business? 3. What makes this data interesting to you to study? Percent of workers doing some or all of their work on their main pb at home, 2006-15 annual averages Transportation and material moving secupation 6.10% Castr uction Sales and era Prede related Installation, cties occupa Olke and administrative perupa maintenance and repair accep Servir ecupatioas support serupations tions occupations ations 12.10% 20.30% 8. 20% 14.50% 10.905 3.0 20. 2.8 7.3 4 24.3 12.3 3.5 5.5 13.7 21.2 9 11.4 IN 5.2 15 26,6 106 11.6 12.2 6) 9.5 30 128 10.1 5.2 10.1 21.4 16 11 21.4 ILI 17 7.9 12 26 IS 4.6 10.5 22:1 11.2 162 9.6 5.5 Prefers iemal Year and Management, business. bred and financial operations occupa Total scenpatinas thens 2008 21.109 32.30% 33.2014 2007 19.9 323 30.6 2003 21.1 29.3 23.6 35.5 38.3 2010 6 32.9 2011 20 2012 232 35.5 37 2013 22.9 35:1 34,8 2014 23.1 36.3 54 2015 24.1 37.3 Retreived from: The Bureau of labor Statistics 6 23 142 33.5 11 6.6 10.3 52 7.2 6.2 6.3 346 Chart Title The chart and data analysis show a significant increase in the WE can see that not every occupation is able to work from hom phone, and computers seems to be the significant number 4500.00 4000.00 3000.00 2500.00% 500.00 2010 22 2013 2014 Medical person occupation Office and porto Trofeu Send rebied op des hoduction RT IMAGE CHART DATA Percent of workers doing some or all of their work on their main job at home, 2006-15 annual averages 50% Total Management, business, and financial operations occupations Professional and related occupations Service occupations Sales and related occupations Office and administrative support occupations Construction and extraction occupations Installation, maintenance, and repair occupations Production occupations Transportation and material moving occupations 40% 30% 20% 10% 0% 2006 2007 2008 2009 2010 2011 2012 2013 2014 2015 Certo change play. However than tota Seurs US Bureau of Percent of workers doing some or all of their work on their main job at home, 2006-15 annual averages Management, business, and Office and Construction Installation, Transportation Year financial Professional Sales and administrative and maintenance, and material operations and related Service related support extraction and repair Production moving Total occupations occupations occupations occupations occupations occupations occupations occupations occupations 2006 21.1% 32.3% 33.2% 12.1% 20.3% 8.2% 14.5% 10.9% 3.8% 6.1% 2007 19.9 32.3 30.6 11.3 20.7 7.8 10.6 7.3 4.0 6.0 2008 21.1 29.8 32.1 13.0 24.3 12.3 5.5 9.2 5.5 73 2009 23.6 35.5 38.3 13.7 21.7 9.0 11.4 12.0 5,2 6.6 2010 23.6 32.9 32.9 150 26.6 10,6 11.6 12.7 6.3 10.3 2011 21.3 34.2 9.5 20.0 12.8 10.1 11.3 5.2 5.2 2012 232 35.5 37.0 10.1 21.4 9.3 16.0 62 72 2013 22.9 35.1 34.8 11.0 11.1 17.0 14.8 7.9 6:2 2014 23.1 36.8 34.0 12.0 26.0 8.5 15.0 9.5 4.6 6.3 2015 24.1 37.8 346 10.5 22.1 11.2 16.2 9.6 5.5 7.7 33.5 14.7 21.4