

Question: statistic and probability Frequency table results for Less than 10: Count = 756 Less than 10 . Frequency . Relative Frequency + 0 252 0.33333333
statistic and probability
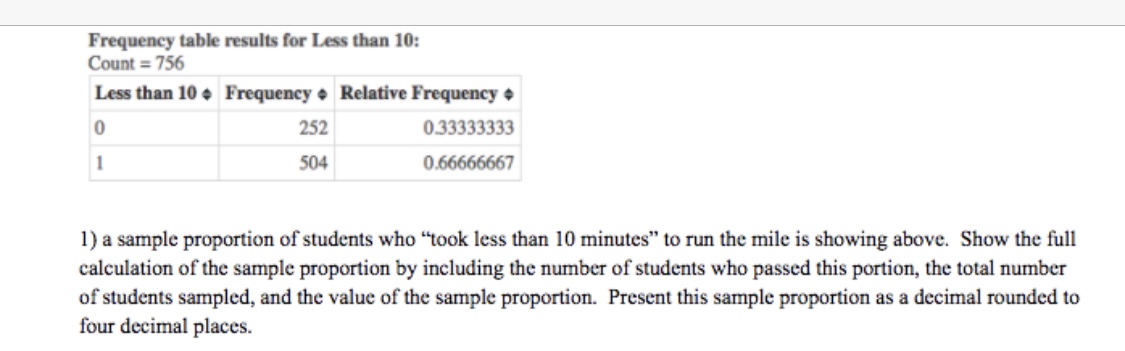
Frequency table results for Less than 10: Count = 756 Less than 10 . Frequency . Relative Frequency + 0 252 0.33333333 504 0.66666667 1) a sample proportion of students who "took less than 10 minutes" to run the mile is showing above. Show the full calculation of the sample proportion by including the number of students who passed this portion, the total number of students sampled, and the value of the sample proportion. Present this sample proportion as a decimal rounded to four decimal places.he Physical Fitness Test (PFT) is a comprehensive, health-related physical fitness battery of tests for students in K - 12. One itness area is Aerobic Capacity and is tested by having students run one mile. In a particular county in Virginia, a sample of juniors in high school was collected and presented in the data set called "Running a Mile." If the student ran he mile in less than 10 minutes, they passed his portion of the test (and is recorded as a "'I " in the data set)
Step by Step Solution
There are 3 Steps involved in it

Get step-by-step solutions from verified subject matter experts