

Question: Statistic Emergency!!! Pls hlep to do it as fast as possible! Time limitations is ONLY 1 hour. Or u just leave wt u can do.
Statistic
Emergency!!!
Pls hlep to do it as fast as
possible!
Time limitations is ONLY 1 hour.
Or u just leave wt u can do. l'Il
prate ur answer.
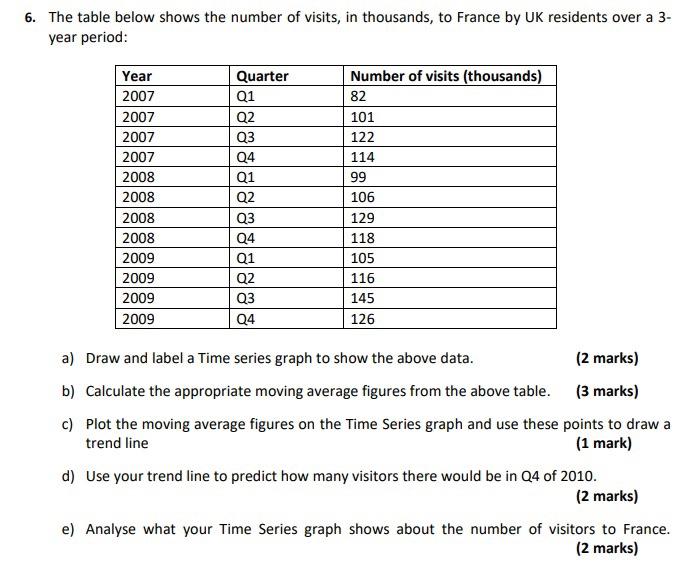
6. The table below shows the number of visits, in thousands, to France by UK residents over a 3- year period: Quarter Q1 Year 2007 2007 2007 2007 2008 2008 2008 2008 2009 2009 2009 2009 Q2 Q3 Q4 Q1 Q2 Q3 Number of visits (thousands) 82 101 122 114 99 106 129 118 105 116 145 126 Q4 Q1 Q2 Q3 Q4 a) Draw and label a Time series graph to show the above data. (2 marks) b) Calculate the appropriate moving average figures from the above table. (3 marks) c) Plot the moving average figures on the Time Series graph and use these points to draw a trend line (1 mark) d) Use your trend line to predict how many visitors there would be in 24 of 2010. (2 marks) e) Analyse what your Time Series graph shows about the number of visitors to France. (2 marks)
Step by Step Solution
There are 3 Steps involved in it

Get step-by-step solutions from verified subject matter experts